
This map drawn in 1942 shows the locations of exposed terraces, the Red Mountain thrust fault, and the Ventura avenue anticline. As noted in the report, this area bares evidence of frequent geologic activity.
This map drawn in 1942 shows the locations of
exposed terraces, the Red Mountain thrust fault, and the Ventura avenue anticline.
As noted in the report, this area bares evidence of frequent geologic activity.
Terraces / Uplifting (unknown source) [ HELP - if you know the source let me know! (please) ]
 LINK
LINK
This graphic shows three things. The map
of the coastline shows the location of exposed marine terrace, the graphic depicts
the rise of sea level in post glacial times and the profile shows the uplifting
rates (the transects are labeled on the map).
Source: Santa Barbara and Ventura Basins Tectonics, Structure, Sedimentation, Oil fields Along an East-West Transect. Edited by A.G. Sylvester and G.C. Brown. Coast Geological Society Guidebook 64. Ventura, California. April 1988


Ventura Avenue Anticline, note oil rigs line-up along the anticline in the Santa Barbara Channel.
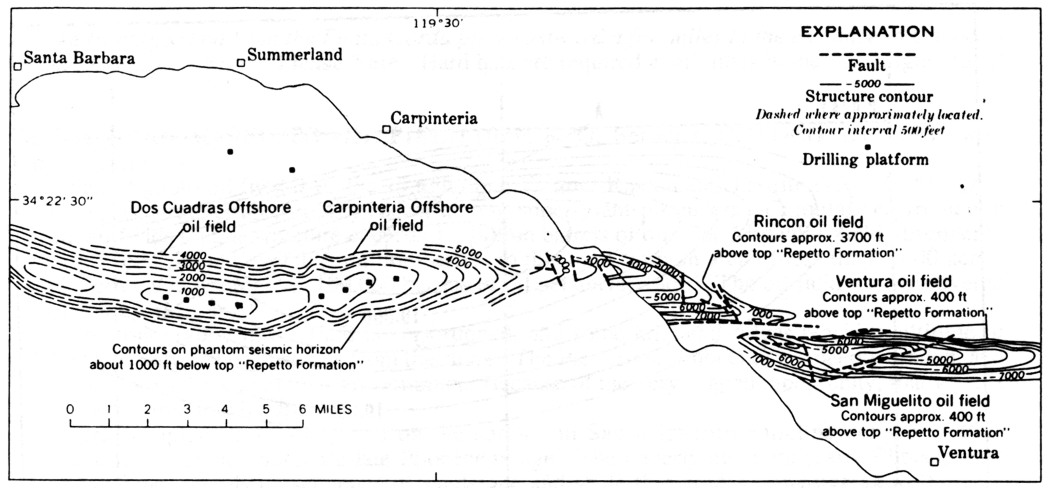
This map shows the offshore oilfields around Carpinteria and onshore at La Conchita

Shows the number of times per century that shaking
from earthquakes will exceed 20% the force of gravity. Damage to non improved
buildings begins to occur at this intensity.
Map produced February 2 2000 by Ken Handout USG
Pasadena, Southern California Earthquake Center


