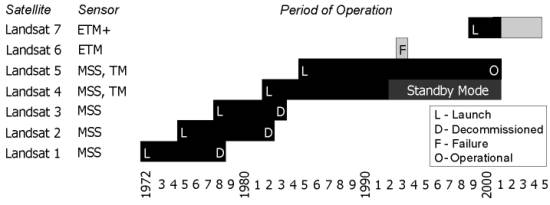
Figure 1. Chronology of Landsat series launches and mission cycles from 1972 to the present. note: Landsat 4 in standby mode since February 1998.
A thesis submitted in partial satisfaction of
the requirement for the degree of
Masters of Arts In Geography from the University
of California Santa Barbara
By Jeffrey John Hemphill, March 2001
Committee in charge:
Professor John E. Estes, Chairman
Professor Keith C. Clarke
Professor Dar A. Roberts
Abstract
This study presents the rationale in favor of the U.S. Government, specifically the United States Geological Survey, implementing coordinated operations of the Landsat 4, 5 and 7 earth imaging satellites. As a part of this study, we provide a brief summary of the history as well as discuss the current status and direction of the Landsat Program. It is evident that policies, and, in particular, the attempts at commercialization of the program, have kept the program from achieving the expectations of its early proponents in terms of the widespread science and applications use. Programmatic issues, operational costs and data policies have made it difficult, if not impossible, to test the true potential of improved observational frequency to address key science questions related to important ecological issues such as those of global environmental change scientists. The value of coordinated operations stems primarily from increased frequency of observation that would greatly improve the probability of cloud free image acquisition. For a number of research and applications it is critical to acquire imagery at specific times; multiple satellites with coordinated acquisition schedules increase the probability that usable data will be acquired. Our analysis indicates that if the operational use of Landsat satellite data is to become truly widespread, the coordinated operation of two or more satellites will be required.
I Introduction
Presented in this paper are the rationale in favor of the U.S. Government (USG), specifically the United States Geological Survey (USGS), taking over, if offered, the operations of Landsat 4 and Landsat 5 from Space Imaging Corporation the current Landsat commercial provider.
The need for timely sources of environmental data and information was recognized early by one of the principal drivers in the development of the Landsat program. Reporting to the U.S. House of Representatives, in the early 1970s, Dr. William T. Pecora stated that, "a real need exists for new and more timely sources of environmental and resource information” (Pecora, 1972). Landsat imagery has been available to the science community continuously for more than a quarter of a century. During this time there have been periods when more than one Landsat system has been operating at the same time. During these periods there was an opportunity to test the higher revisit frequency for obtaining cloud free data and for improved support of both science and applications.
No documented attempt has been made to test the full potential of synergistic operation of these systems. Many factors may have contributed to the lack of documentation on the potential of coordinated operations. These include data processing requirements, data handling and storage capabilities, and funding priorities. Furthermore, a review of the literature related to the operation of other land observing satellite systems, e.g. French SPOT Systeme Probatoire de la Observation de la Terre (SPOT) and Indian Remote Sensing (IRS) satellites, shows that to date there have been no detailed reviews of the value of coordinated operations of these systems either.
If we examine the fundamental concepts involved in the analysis of remotely sensed data we find the concept of multi-temporal data acquisition prominently mentioned (American Society of Photogrammetry - ASP, 1975 and 1983; Avery and Berlin, 1992; Jensen, 1996; Jensen, 2000). While the current 16 day repeat cycle provides multi-temporal coverage, more frequent data acquisitions are required to address critical science questions and specific applications which are time dependent, i.e. ephemeral events and natural disasters (National Aeronautics and Space Administration (NASA), 1984; Jackson, 1989; Davis et al., 1991; Jensen and Cowen, 1999; Estes, 2000; Hadley, et al., 2000; Lulla and Dessinov, 2000).
Current programmatic issues, operational costs and data policies have made it difficult, if not impossible, to test the real potential of improved observation frequency for addressing key science questions related to global change. These issues have also made it difficult to demonstrate operational applications to potential users. Davis et al. (1991) described the pressing need for such research at that time, "Although satellite remote sensing has long been advocated for monitoring surface processes through time, there has been remarkably little progress made in quantitative spatio-temporal analysis of multi-temporal imagery, particularly for land surface analysis". This statement remains true ten years later, short term multi-temporal scientific investigations using satellite imagery are rare. Should coordinated operations be implemented in the Landsat Program the potential would definitely exist to initiate research and applications testing to address this issue.
There is considerable value to be gained from the coordinated operations of Landsat 5 and 7 in particular, and Landsat 4, if practical. This value is derived primarily from the increased frequency of observation and an added level of assurance for long-term data continuity that would be provided should coordinated operations be implemented. Such operations would not only improve the probability of cloud free acquisition but could facilitate studies directed at the documentation of an optimum frequency of observations required in a number of science and applications areas. Coordinated operations will also facilitate state and local, as well as international, applications programs that utilize Landsat imagery. This international involvement holds the promise of long-term profitability if a broad enough user community can be assured that Landsat data will be available in the future for the applications programs that are beginning to form now.
In the material that follows we provide a brief general overview of the Landsat Program. This material traces the history of the program, discusses the current status of the program and summarizes current directions. This is followed by general technical background material on the Landsat series of satellites, with emphasis on the characteristics of the more recent systems. Science and applications drivers follow, as does a discussion of the key stakeholders and their potential interest in coordinated operations. A discussion of a number of challenges, issues, and arguments supporting coordinated operation are then presented. The final section of this white paper consists of the conclusions and recommendations that flow from this exercise.
II Landsat Satellite Program General Background
As early as 1946 the United States Government began to pursue an operational space based imaging system when the Air Force asked the RAND Corporation to explore the possibility of launching an object into orbit (Mark, 1988). An early experiment in satellite land remote sensing was conducted from the Explorer 6 platform in 1959. The synoptic images of Earth’s weather patterns acquired by the Television and Infrared Observational Satellite (TIROS-1), launched in April of 1960, captivated the American public and demonstrated the capability and necessity of earth observation from space. Also in 1960 the first experimental spy satellite, a component of what would later become known as the Corona Program, was launched and, shortly there after, classified as secret. These data were withheld from the public until 1995, when the imagery and documentation were released to the public under Executive Order 12951 (Jensen, 2000; National Reconnaissance Office Homepage, 2000). In 1965 NASA initiated the Earth Resources Survey Program (ERS). This early program sought to develop methods and applications for remote sensing. The Department of Agriculture researched the use of remote sensing for geology, hydrology, geography and cartography applications (Program Chronology, 1998). In 1966 the Department of Commerce began to participate in the ERS program by establishing the Environmental Sciences Group with the Environmental Sciences Administration (the predecessor to NOAA). Also in 1966, the Department of the Interior initiated the multi-agency Earth Resources Observation Satellite Program, which studied the potential for using Earth observing satellites for natural resources applications. The Program Chronology (1998) and Lauer (1990) are used as principal source material for the factual information contained in this historical summary of the Landsat Program.
During the 1960’s and into the mid 1970’s NASA and a number of other Federal Agencies focused a significant amount of attention on applied remote sensing research. This was, in part, aimed at justifying the need for civil land satellite remote sensing systems and cataloging the variety of fundamental and applied science questions that could be addressed by such systems. The results of these activities, and the state-of-the-practice of remote sensing during this time period, are documented in the National Academy of Sciences publication on Remote Sensing with Special Reference to Agriculture and Forestry (1970); Holz (1973), Estes and Senger (1974) and, the American Society of Photogrammetry’s (ASP) first edition of the Manual of Remote Sensing (1975).
The first Earth Resources Technology Satellite (ERTS-1) was originally designed as a experimental research tool. When it was launched in July of 1972, however, this satellite ushered in a brief era of emphasis by NASA on the demonstration of operational applications. Through 1974, the ERTS-1 satellite transmitted over 100,000 images covering 75% of the Earth’s land surface. More than 300 US and foreign investigators received data (Ellickson, 1998). During the period between 1972 and 1978 major research projects in agriculture, forestry, water resources, and geology were conducted (ASP, 1975 and 1983). This was the time of the NASA Regional Applications Programs. These programs run out of NASA Centers at Ames, at Moffet Field in California, Goddard Space Flight Center in Greenbelt Maryland, and the National Space Technology Laboratories in Slidell, Louisiana, helped introduce state and local governments and industrial concerns to the potential applications of satellite remotely sensed data (Weinstein, 1980). In addition, between 1973 and 1975 three NASA Significant Results Symposia were held in Houston, Texas and Greenbelt, Maryland. Other notable regional scale applications research in the 1970’s included:
· The Large Area Crop Inventory Experiment
(LACIE), (Myers, 1975)
· Agricultural and Resource Inventory Surveys
Through Aerospace Remote Sensing (AgRISTARS), (ASP, 1983)
· NASA Geosat Test Cases (Abrams et. al.
1994), and
· The Western Snow Melt Application System
Verification Test (ASVT) (Deutsch, et al., 1979; ASP, 1983).
Figure 1. Chronology of Landsat series launches
and mission cycles from 1972 to the present. note: Landsat 4 in standby mode
since February 1998.
Institutional problems among the various Federal Agencies involved in space technology plagued the satellite civil land remote sensing program after the successful launch of Landsat-1 (U.S. Congress, 1977). One agency in particular, the Office of Management and Budget (OMB), had opposed the program from its beginning in the mid-to-late 1960’s (Lauer, 1990). Mack (1981) cites four reasons for OMB’s opposition to this program (some of which may still be true today). These were:
1. A suspicion concerning the promised benefits
of the program;
2. A fear by ex-intelligence agency and Department
of Defense personnel on OMB staff who were concerned about the risk of calling
attention to Earth orbiting satellites which were vital to national security;
3. A questioning of whether satellites could perform
Earth resources surveys as well as aircraft; and,
4. The desire to hold down the federal budget.
Although then President Lyndon B. Johnson approved the Earth Resources Technology Satellite (ERTS), OMB opposition resulted in a limited experimental program that was not to become operational until cost-benefit analyses showed the potential for cost-effective operations.
From early in the ERTS (later renamed Landsat) Program, to the mid 1970’s, a number of cost benefit studies were conducted (Krzyczkowski, et al., 1971; Zissis, et al., 1972; Earth Satellite Corporation, 1974; ECON Incorporated, 1974; Space Applications Board, 1975). These studies attempted to document the benefits and the costs of a civilian satellite land remote sensing program. Several of these studies were quite detailed, and included analyses of the cost and benefits that could be expected in specific application areas (Earth Satellite Corporation, 1974; ECON Incorporated 1974).
In 1975 Landsat 2 was launched and the Ford Administration approved budget appropriations for Landsat 3, which was launched in 1978. In 1977, President Carter directed the National Security Council (NSC) to lead a review of the United States space policy. This review resulted in the May 1978 release of Presidential Directive/NSC-37, which articulated broad national space policies and encouraged domestic commercial exploitation of space (U.S. Department of Commerce, 1980). The following October, a more detailed space policy was promulgated in Presidential Directive/NSC-42. This time, the Directive mandated the active consideration of greater private sector involvement in remote sensing activities. It also called for the review of possible organizational arrangements among Federal Agencies participating in the satellite land remote sensing program. In March of 1979, President Carter announced the Administration’s commitment to maintaining the continuity of civilian terrestrial satellite remotely sensed data and recommended the transition of the program to the private sector.
In 1979, the Carter White House issued Presidential Directive/NSC-54, which mandated the development of an operational civil land remote sensing program and gave management responsibility for the program to the National Oceanic and Atmospheric Administration (NOAA), part of the U.S. Department of Commerce (White House, 1979). This Directive stated the specific goal of transitioning the program to the private sector gradually over the coming decade. This was the pivotal policy decision, made primarily under the direction of OMB, that officially moved the United States satellite land remote sensing program from an experimental stage to operational status. This initiated the process of program commercialization that would come to fruition in the middle of the 1980’s. In 1981 the Reagan Administration accelerated the pace of Landsat commercialization by essentially rejecting the Carter Administration’s commitment to an operational civilian land remote sensing program and advocating the immediate end of government funding for the Landsat Program. At this time a significant shift in research emphasis began to take place within the Earth Science and Applications program of NASA; emphasis was placed on fundamental science research while applications-related activities were to be curtailed.
By the middle of the 1980's it was clear that satellite remote sensing could provide globally consistent, spatially disaggregated, and temporally repetitive coverage of the land surface of the Earth (Goward and Williams, 1997). Landsat 4, with the first Thematic Mapper instrument, was launched in 1982. Higher spatial resolution multispectral imagery was now publicly available and could be applied by scientists and professionals to the assessment of terrestrial ecosystems and studying land cover change. A number of researchers began to develop techniques that use the spectral information from Landsat to measure vegetation status, phenologic state, as wells as inter-annual variation (Rouse et. al., 1973, Kauth and Thomas 1976; Blair and Baumgardner, 1977; Richardson and Wiegand, 1977; Tucker, 1979). These studies then lead researchers such as Kumar and Montieth (1982), Goward (1989) and Asrar (1989) to the development of vegetation measures that provide an index of condition and, in part, describe absorption of sunlight, photosynthetic capacity and evaporation rates (Kumer, 1982, Goward and Williams, 1997, Asrar, 1989). With this research, the science community began to understand that space-based, Earth imaging could and did provide valuable information concerning the spatial and temporal patterns associated with land processes. In commenting on this period of potential applications demonstration, Goward and Williams further stated that, "… the possibility of developing fully integrated land-ocean-atmosphere monitoring and modeling capabilities was realized… thus Landsat provided the critical element of Earth Observation needed to develop the concept of Earth System Science.”
In March of 1984 Landsat 5 was launched and in July of that year the U.S. Congress provided the legislative authority to transfer the Landsat program to the private sector. This transfer occurred following years of discussion, including some strong objections by at least one Federal Agency, the U.S. Department of Interior. This transition period also coincided with a significant increase in scientific attention directed at studies of global physical and environmental processes (Goward and Williams, ibid). Thus began the nearly decade long period of “commercialization” of the U.S. civil land remote sensing program. Commercialization (and the subsequent price increases for Landsat data) caused a shift in scientific research emphasis. Researchers began to move away from Landsat imagery and began to design experiments utilizing NOAA polar orbiting meteorological satellites and their Advanced Very High Resolution Radiometer (AVHRR) sensor system as a primary data source for scientific research. This shift was the result of increased costs, greater restrictions on sharing and more limited availability of Landsat data to both the basic and applied land remote sensing community.
The U.S. government (USG) would not regain operational control of the Landsat program until the late 1990’s. Essentially, though the law changed in 1992, the USG did not get control of any orbital assets until Landsat 7 was launched in April of 1999. The commercial pricing and data sharing restrictions prior to this transition back to USG pricing had a negative effect on the developing research and applications programs at the time which sought to utilize satellite imagery but could not employ it due to the high data cost. It would not be until the new millenium that the Landsat program would begin to come under the control of an operational land oriented Federal Agency, the United States Geological Survey (USGS).
The movement of the Landsat Program to the private sector, and the rise in emphasis on fundamental science oriented research within NASA, did not mean that there were no opportunities to conduct Landsat based science and applications research under NASA funding. Research using Landsat data during this time included work in many disciplines and applications areas (Moran et al., 1989; Hall et al., 1991; Flynn and Mouginis-Mark, 1995; Wolter, et al., 1995; Lunetta and Balogh, 1999; Coops, 1999; and Kettles, et al., 2000). Of particular significance was the research that evaluated the use of multi-temporal Landsat data to monitor tropical deforestation (Nelson, et al., 1987; Skole and Tucker, 1993; Townshend, et al., 1995). This work and work by personnel of the Department of the Interior (USGS, 1995) have unambiguously demonstrated the value of time series data for providing information on changes occurring in areas around the world, particularly in the tropics. Numerous Earth observing satellite sensor systems exist but none have the track record of the Landsat Thematic Mapper sensor. Beginning in 1984 with the launch of Landsat 4, information about the sensor’s spectral calibration have been collected and used to refine the spectral response functions which are used to correct imagery collected by different Landsat satellites. There is a NASA project that is currently underway to compile a complete history of calibration data for all of the Landsat satellites to be used for the validation of data gathered by other earth observing sensor systems, i.e. the Modis and Terra data products (Woodcock, 2000). This calibration history will be useful for projects that utilize both historic Landsat data and Landsat 7 data because this record allows for accurate cross calibration and comparison of data collected by the different Landsat systems.
The concept of dual operations could have been tested from 1985 to 1992 when Landsat 4 and 5 were both operational. However, our review of the literature published during this period shows no evidence that such tests were conducted. It is reasonable to infer that the factors cited above (e.g. data pricing, restrictions on use, etc.) had an impact on the research going on in the field at the time. The commercial vendor’s lack of incentive for actively marketing such an opportunity under the operational subsidy in place at the time may also have been a factor.
With the return of the Landsat Program to the USG in the 1990's there has been a renewed interest in the potential of Landsat data to support both fundamental and applied research. Interest in the use of Landsat data, particularly Landsat 7 data, continues to grow. The number of products ordered per week has increased from ~100 in August of 1999 to ~400 in August 2000. As of the end of July 2000, 46% of sales of Landsat 7 data were to governmental agencies; 24% of data sales were to industry, much of which was for use in government funded projects. Only 16% of sales of Landsat 7 data were to academia, while 14% were sold to international customers (Landsat Mission Management Office, 2000). The increase in data orders to USGS Eros Data Center is evidence for substantial increase in demand of Landsat data at USG costs. Fundamental and applied research results from the analysis of Landsat 7 data are as yet difficult to document. Landsat 7 was launched only one year ago. It is still too early for research results to be published in the reviewed journal literature by researchers who have access to Landsat 7 data at the more affordable USG costs.
The Department of the Interior/USGS assumed control of Landsat 7 program management and operations on October 16, 2000, under the authority of an Amendment to Presidential Decision Directive/NSTC-3 (White House, 2000). The subject of this Presidential Decision Directive (PDD) is the overall Landsat Remote Sensing Strategy.
Under this PDD, the Department of the Interior/USGS will:
1. Assume responsibility for management and operations
of the Landsat 7 ground system elements at the USGS EROS Data Center and the
Landsat 7 Program Management Office and its oversight functions.
2. Assume responsibility, beginning in FY2001,
for the Landsat 7 Flight Operations Center. In coordination with Department
of Commerce (DOC) and NASA, revise the original Management Plan for the Landsat
Program to reflect the changes implemented through this directive, including
programmatic, technical, schedule, and budget information.
3. In participation with other appropriate government
agencies, arrange for the continued operation of Landsat 4 and 5.
4. Continue to maintain a national archive of
existing and future Landsat-type remote sensing data within the United States
and make such data available to the U.S. Government and other users.
5. In consultation with the Department of State,
establish cooperative data-sharing and data-access arrangements with foreign
ground receiving stations for U.S. Government and private sector users of Landsat
data collected at foreign ground stations, and consult with the Department of
State on all other matters related to international obligations and policies
affecting the Landsat program.
6. Seek to offset U.S. ground-system operations
costs through use of cooperative arrangements with foreign ground stations and/or
reimbursements of fulfilling user requests.
7. Solicit and coordinate future Federal-agency
requirements for civil operational land remote sensing data.
8. Work with NASA and other relevant agencies
to develop a strategy for maintaining continuity of Landsat-type data beyond
Landsat 7 that is consistent with each agency’s expertise and mission.
Additionally, the National Aeronautics and Space Administration will:
1. Transition the Landsat 7 ground system to
DOI/USGS in accordance with the signed agreement between NASA, DOC, and DOI.
2. Transition Flight Operations Center responsibilities
to the USGS by FY2001. In coordination with the DOC and DOI, revise the original
Management Plan for the Landsat Program to reflect the changes implemented through
this directive, including programmatic, technical, schedule, and budget information.
3. Work with the USGS and other relevant
agencies to develop a strategy for maintaining data continuity of Landsat-type
data beyond Landsat 7 that is consistent with each agency’s emphasis and mission.
Finally, the Department of Commerce/NOAA will:
In coordination with the DOI/USGS, implement the joint transition plan to transfer responsibilities to the USGS.
What is the future of the Landsat series of satellites? What form will the Landsat program take next? Who will control Landsat operations? These are all open questions at this time.
Currently the USG has made no firm commitment to the long term continued operational acquisition of Landsat type data. Without such an assurance it continues to be somewhat difficult to persuade the user community, both US and International, to invest the resources necessary to provide for operational applications programs at the state and local level. Coordinated operations of both Landsat 5 and Landsat 7 might allow for the time necessary to develop administrative and congressional approval of a comprehensive policy for the acquisition and distribution of Earth observation data for both public and commercial use (Sheffner, 2000).
At this time it appears that the leadership of NASA's Earth Science Enterprise is moving strongly towards a concept of commercial development based on the continuity of the Landsat Program and the use of data buys to support the needs of the NASA related science and applications community. Others have suggested the possibility of developing an international consortium that could provide for long-term continuity of civil land satellite remotely sensed data (Lauer, 1990). A debate is also currently taking place in the United States over the Landsat follow-on mission (the Landsat Data Continuity Mission). Four options have been published for this Mission (Bailey, et al., 2000):
1. Returning Landsat to the Private Sector,
2. Keeping Landsat as a U.S. Government System,
3. Seeking a Government/Private Sector partnership,
and
4. Seeking an International Partnership.
Which of these options (or others) to follow, will be debated in the future. Interested stakeholders are encouraged to follow this debate closely and make their opinions known. It is clear, however, that in the near future the potential may exist to test the science and applications advantages of the increased repeat frequency that coordinated operations of Landsat satellites would provide. Such tests would have implications beyond current science and applications. In addition, such studies could also provide important inputs to Landsat follow-on planning and operations.
As we expand our understanding of the benefits associated with operations of multiple satellites, the lower cost associated with USG control of data pricing and the higher overall data volume that would be available, the true benefits of coordinated operations will become apparent. Furthermore, if for some reason Landsat 7 were to fail, Landsat 5, if it can be maintained in an operational mode, could satisfy user needs as well as acquire imagery to maintain data continuity and augment the global archive. Such a failure would be devastating for current and planned research based on Landsat data, as well as the Landsat Program as a whole. Concurrent operation of Landsat 5 and Landsat 7 will provide needed insurance, with so much riding on one satellite it is very risky to not have a backup.
III Technical Discussion and Background of Landsat
Currently, Landsat 5 is in normal operational mode, while Landsat 4 has been on standby since February of 1998. The Landsat 4 and 5 platforms have exceeded their design lifetime and continue to be monitored for any sign of failure, degradation or malfunction that would prevent a safe deorbit.
Vital to the navigation of each satellite, aside from the flight computer, are the platform’s inertial guidance systems. The integral components of the Landsat guidance system are gyros and hydrazine fueled thrusters, which are used to adjust the attitude and trajectory of the spacecraft. Monitoring these elements of the orbital and stabilization systems is critical. In the event that there is a malfunction or a sign of degraded performance in the gyros it is necessary that immediate action be taken to deorbit the satellite over an unpopulated area. A status test of Landsat 5 concluded in August, 2000 showed that the spacecraft is functioning normally (Landsat Mission Management Office, 2000, Thompson, 2000 a). Landsat 5 uses two gyros for maneuvering and has a spare gyro. The gyros aboard Landsat 4 and Landsat 5 were tested over a three-day period in early 1999. This test included recording and analyzing the latency, or time delay, in the electrical current transmitted by the gyro sensors. The results of these tests, which monitored the dampening of high and low voltage peaks, showed no change over the past two years. Another test involved assessment of the signal strength from the X-Band Helix of Landsat 5 that is used to downlink data. The strength of this signal has not changed in the past three years indicating no loss of power or battery degradation. Sun tracking silicon solar cells provide power to the nickel-hydrogen batteries, the hydrazine fuel aboard Landsat 5 has been depleted after more than 15 years of operation. Landsat 7, with similar sun tracking solar cells and battery technology, was launched with 269 pounds of hydrazine onboard, only 149 are projected to be used over the course of the spacecraft’s five-year mission plan. (VAP, 1999)
Tracking the satellite’s ground position is another system-critical capability that is assessed in order to appraise the satellite’s status. Determining the position and three-dimensional orientation of the satellite is a complicated process involving sidereal charts, telemetry signals, orbit models and the inertial guidance system. These systems are used to predict the ‘ground track’ of the satellite over the Earth’s surface, assign path/row designations and coordinate with ground receiving stations for down-linking data. Landsat satellites use a digital star chart to determine their position relative to the star field visible to the satellite. The ground track prediction for Landsat 7 is +/- approximately 3 km (Landsat Mission Management Office, 2000). Ground tracking enables the timing and acquisition of image data and is an integral part of the data stream; knowing where the satellite is and the precise latitude/longitude enables connection with downlink stations and becomes part of the image metadata used in the processing phase. In February of 1998 orbital inclination maneuvers were undertaken so as to put Landsat 4 back on the documented equatorial crossing time of 9:45AM +/-15 minutes local time. Landsat 4 has limited capabilities, it can acquire MSS imagery and transmitting it via S band downlink but there are no longer any data processing systems in the US that are capable of turning the transmitted signal into usable products. In the experience of one researcher the last Landsat 4 image available was October 1992 (Roberts, 2000, personnel communication) Landsat 4 was used recently however as an experimental platform with which maneuvering routines could be tested before being applied to Landsat 5 or Landsat 7 (Ellickson, 1998). Another critical component for the continued operation of Landsat 5 is the continuity of downlink stations around the globe.
A country interested in having Landsat 5 acquire imagery prior to the launch of Landsat 7 (and the return to USG pricing) could either purchase it from the commercial vendor for about $2,500 - $4100 per scene, or purchase a license/contract for a ground receiving station from the commercial provider for about $450,000 - $500,000 (Landsat EOSAT Pricing, 1997, National Satellite Land Remote Sensing Data Archive Advisory Committee, 1999). More than a dozen countries around the world have purchased downlink rights. Landsat 5 can only transmit the data it collects to downlink stations. Landsat 7 is equipped with about 50 gigabytes of solid state memory that can be used to temporarily store 100 scenes onboard in the event that no downlink is available. It can also use Tracking Data Relay Satellites (TRDS) to upload, via S band, command instructions (Sheffner, 2000, Jensen, 2000). This inability to store large amounts of data or relay commands via other satellites is not a problem for the continued operation of Landsat 5 as long as a network of ground receiving stations is maintained. Currently, 22 ground receiving stations are in existence. Perhaps six of these are operational ground stations with contracts with Space Imaging for downlinking Landsat 5 data. Recent or historical statistics on the number of scenes downlinked from Landsat 5 by individual international ground receiving stations and whether or not they plan to extend expiring contacts are not readily available (Thompson, 2000 b).
In 1997, however, Landsat 5 transmitted 277,000 TM scenes (Landsat Mission Management Office, 2000). The status of current Landsat 5 downlink station contracts is pending the outcome of the transition of operations. Between July, 1999 and March, 2000, 17 ground receiving stations for Landsat 7 have been activated or have agreed to become part of the global downlink station network. The countries and ground stations that constitute the current downlink network are, in order of their start date:
1. Australia Center for Remote Sensing, Alice
Springs
2. Canadian Centers for Remote Sensing, Prince
Albert and Gatineau, Canada
3. National Institute for Space Research, Cuiaba
Brazil
4. European Space Agency stations, Fucino, Italy
and Kiruna, Sweden
5. Australia Center for Remote Sensing, Hobart,
Tasmania
6. European Space Agency station, Neustrelitz,
Germany
7. National Commission for Space Activities station,
Cordoba Argentina
8. European Space Agency station, Maspalomas Spain
9. China Academy of Science Remote Sensing Ground
Station, Beijing, China
10. National Space Development Agency, Hiroshima
Japan
11. National Space Development Agency, Hatoyama,
Japan
12. Indonesian National Institute of Aeronautics
and Space, Parepare, Indonesia
During 1999, from July to December, nine downlink stations requested almost 55,000 Landsat scenes; about 93% of those scenes were received. During January – August, 2000, almost 90,000 scenes were requested and 78,000 (87%) were received. Since July of 1999 more than 130,000 Landsat 7 scenes have been recorded (Landsat Mission Management Office, 2000).
Acquiring imagery of Earth from the vantage point of space has been facilitated by progressive refinement in the technology involved over three decades. Critical to this refinement were developments in precision electro-optical engineering, advanced materials engineering, physics, cryogenics and signal processing. During the development of the Thematic Mapper (TM) sensor, technical risk, performance and reliability were all balanced to respond to increasingly demanding mission objectives (Mika, 1997). This technical progression of sensor development however has not been steady; budget and schedule pressure have influenced the development and design of the sensor systems carried by the Landsat satellites over the years. The design and improvement process did result in considerable improvements in spatial resolution, spectral range, radiometric sensitivity, calibration, reliability and accuracy of the image products (Lauer et al., 1997; Mika, 1997). Landsat 1 (formerly ERTS-1) was more of an experiment designed to test the feasibility of remote sensing from space, the primary sensing device was called the Multi-Spectral Scanner (MSS) which produced 80 meter resolution images in four spectral bands. The bands and spectral sensitivity of the MSS sensor were chosen to have nearly the same response as that of analog color infrared film which was being used by remote sensing professionals and scientists interested in studies of vegetation at the time. This experiment proved to be a success in terms of gaining support for future Landsat satellites (Lauer, et al., 1997; Mika, 1997).
The launch of Landsat 1 in July of 1972 was the result of cooperation between NASA, Department of Interior, US Department of Agriculture, Department of Commerce and other agencies with the focus being to develop a sensor which would be useful for geologic and vegetation related applications. The first three Landsat satellites orbited at a higher altitude, 919 km, and thus had a longer repeat time, 18 days, and were capable of acquiring 80 meter Instantaneous Field of View (IFOV) resolution imagery using 4 different bands in 183 km wide swaths (Jensen, 1996). With this coarse-scale imagery scientists developed analysis techniques and established methodologies that demonstrated the potential science applications of this early image data. Operational applications such as crop monitoring, forestry and resource management were also developed and implemented. MSS served as a catalyst for scientific and technological development in the field of remote sensing science and created public and political support for the costly research and development program required to design and launch the future Landsat satellites and sensor systems.
The data collected by the Thematic Mapper (TM) instrument represented a huge engineering leap and an even greater leap for scientists in terms of spatial and spectral resolution. Designed using feedback generated by early investigations using MSS imagery, the spectral bands were chosen according to science demonstrated applications capabilities in several key areas. Specific, and variable, spectral bands, some in the infrared range, rather than the fixed interval bands of MSS, were chosen for applications in agriculture, vegetation mapping, mineral exploration and geologic mapping. (See Table I) These bands and their spectral range were debated and defined by scientists with expertise in these fields (Lauer, et al., 1997; Mika, 1997). The TM sensor was developed as a balance between the science established needs and the needs of those interested in applying these data in an operational science based application i.e., forestry, agriculture and vegetation mapping, as well as mineral exploration, land use / land cover and geologic mapping. (See Figure 2)
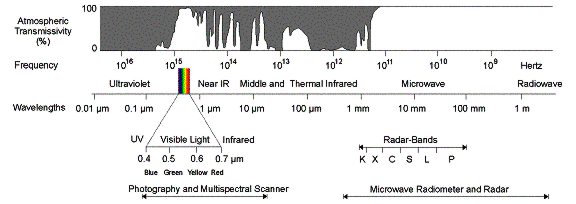
Figure 2. Range of the electromagnetic spectrum
used by remote sensing systems and their respective names. Landsat TM acquires
imagery in the Visible Light part of the spectrum, the reflected Near Infrared
as well as the emitted Thermal Infrared parts of the spectrum.
The Landsat satellites have circular polar sun synchronous orbits; the orbital plane swept out by the satellites as they process around the poles has the same angular velocity as the Earth rotates around the sun. Because of this Landsat satellites cross the equator at roughly the same local time, 9:30-10:00 am, on the sunlit side of the planet each day (Jensen, 1996). The first three Landsat satellites where launched into a 919 km altitude orbit, starting with Landsat 4 and 5 the orbital altitude was changed to 705 km. This low Earth orbit allowed for higher resolution, a shorter repeat time and provided for progressive west to east orbit tracks. The lower orbit would also make it possible for the Space Shuttle to retrieve the satellite if necessary (Sheffner, 2000). The Thematic Mapper instruments aboard Landsat 4, 5 and 7 acquire imagery in 183 km wide 170 km long swaths of 30 meter IFOVs, each IFOV contains reflectivity for each of the seven spectral bands. (See Table I)
Table I. Thematic Mapper Bands for Landsat 5 and Landsat 7 (After Jensen 2000)
Pan Band 0.45-0.9 um Panchromatic (15 m
resolution)
Landsat 7 only, sharpening band, higher spatial
resolution
Blue Band 1 0.45-0.52 um BLUE (30 m resolution)
detecting smoke, shorter wavelengths more easily
scattered by particles
Green Band 2 0.52-0.6 um GREEN (30 m resolution)
useful for detection of aquatic vegetation, turbidity
and sediment
Red Band 3 0.63-0.69 um RED (30 m resolution)
senses in chlorophyll absorption region, strong
reflectance region for soils
Near IR Band 4 0.76-0.9 um NEAR IR (30 m resolution)
distinguishes vegetation varieties, sensitive
to water in soils and vegetation
Mid IR Band 5 1.55-1.75 um MID OR SWIR
(30 m resolution)
sensitive to leaf-tissue water content (turgidity),
ferric/hematite rocks
discriminates between ice/snow and clouds
Mid IR Band 7 2.08-2.35 um MID OR SWIR
(30 m resolution)
absorption band of hydrous minerals (clay mica,
some oxides, and sulfates)
Thermal IR Band 6 10.4-12.50 um LWIR, THERMAL
(120 m for L5, and 60 m for L7)
used to measure radiant surface temps –100C to
+150C
Decreasing the orbital altitude meant that the swaths of imagery would have a different geographic orientation across the Earth’s surface, which necessitated modifying the global reference grid employed for cataloging the imagery acquired by Landsat 1, 2 and 3. The new system, called Landsat World Reference System 2 (WRS), is used for processing and archiving each scene acquired by Landsat 4, 5 and 7 (Jensen, ibid). The orbit is such that each of these three satellites can traverse 233 longitudinal orbit paths in 16 days. (See Figure 3) Landsat 5 and 7 have also employed an automated procedure for determining if it is sufficiently cloud free; for a scene to be acceptable at most clouds can cover 85% of a scene (Stoney, 1996).
The Automatic Cloud Cover Assessment (ACCA) algorithm recognizes clouds based on the assumption that clouds will be colder than normal Earth temperature, which is true most of the time except in instances of temperature inversion. Landsat 7 ACCA uses a two pass approach; first a cloud non-cloud classification is made using temperatures derived from the thermal band, then the pixels classified as containing clouds are rechecked using other band filters. By using different bands, mostly bands 3, 5 and 6, the amount of image pixels containing clouds can be determined with a fair degree of confidence prior to archiving (Irish, 1998). The information derived from this cloud assessment procedure is encoded into the image metadata and becomes part of the data stream.
Also part of the data stream is the path/row of scene center and coordinates. Each satellite is controlled by an inertial guidance system consisting of gyros that maintain the three-dimensional attitude of the satellite relative to the Earth’s surface to within 0.050. Each of the 6,000,000+ scenes acquired since the launch of Landsat 4 in 1982, including imagery from Landsat 5 and 7, have been tagged with an individual reference according to the location of the scene center, which translates to a unique numerical designation according to the WRS path/row system. Landsat 4, 5 and 7 take 98.9 minutes to orbit the Earth and cross the equator between ~9:45 and 10:00 AM +/- 15 minutes each day.
The Thematic Mapper sensor aboard Landsat 7 generates heat in the process of acquiring imagery. This excess heat build up limits the amount of time that the satellite can actively acquire imagery and necessitates periodic downtime in order to cool. This periodic downtime is termed the “duty cycle” and during this time no imagery can be acquired. The duty cycle for Landsat 7 limits it to only 34 minutes of activity per orbit, 52 minutes are available for image acquisition for every two orbits. About an hour and a half of imaging are possible during the time span of six orbits and a maximum of about four hours of operating time per 24 hours are possible, the remainder of the time is required for cooling. This duty cycle constraint of Landsat 7 may be compensated for by coordinated operations, during Landsat 7 downtime Landsat 5 can acquire imagery. Furthermore, Landsat 5 imagery can be used to augment the global archive if the imagery acquired by Landsat 7 is of marginal quality due to cloud cover or haze. During this time, and in the future, Landsat 5 can be used to downlink requested imagery to ground receiving stations that have requested scenes during the Landsat 7 duty cycle. The Long Term Acquisition Plan calls for the maintenance of the global archive of imagery and is the primary task of Landsat 7, Landsat 5 could be used in data collection efforts for regional and global scale projects and help to augment the global archive.
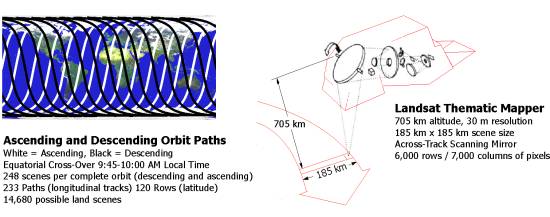
Figure 3. Left: Ascending and descending orbit
paths. Right: Landsat TM instrument schematic.
IV Science and Applications Rationale for Coordinated Operations
In 1988 the Earth System Sciences Committee of the NASA Advisory Council published a report with the title, Earth System Science: A Closer View. This report contains an assessment of the quality and the importance of long-term measurements of variables deemed important in the study of global change on timescales of decades to centuries. (See Table II)
Considering only Land Surface Properties:
· Three of the 13 land surface properties
listed are considered essential to an understanding of global change; two of
the three are listed as having no information available and one as a qualitative
index with doubtful interpretation.
· One is ranked as having high importance
but with no data available.
· Nine are of substantial importance (the
lowest category ranked): of these nine properties four have no information,
one is listed as a qualitative index whose interpretation is doubtful, three
are listed as being useful but poor discrimination and only one is listed as
well discriminated, but absolute accuracy doubtful.
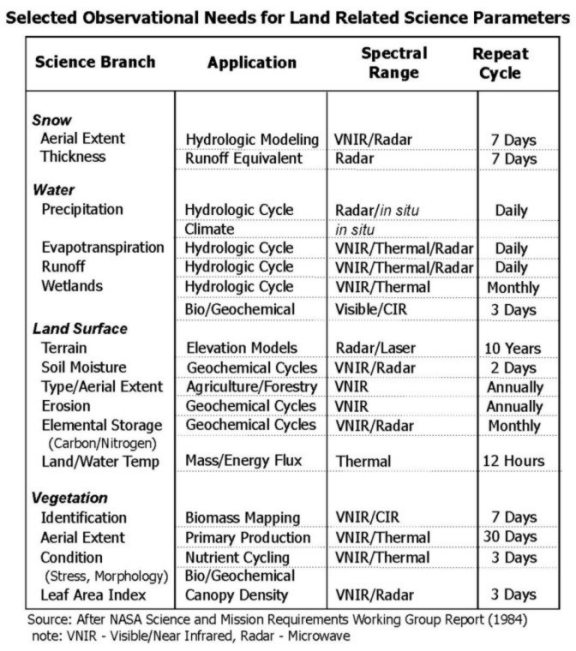
While the availability and usability of data for some of the Land Surface Properties listed in Table II have improved, there are still some reasons to believe that we can substantially improve our overall understanding of global conditions through the use of the long-term data record provided by systems such as Landsat. If we look at the land related observational needs laid out by the Science and Mission Requirements Working Group (NASA, 1984), we find that a number of the observations listed are within, or close to, the spatial and temporal sampling frequency that could be achieved with coordinated operations of Landsat 5 and 7. (Table III)
Table II Sustained, long-term measurements of
global variables important for the study of global change on timescales of decades
to centuries.
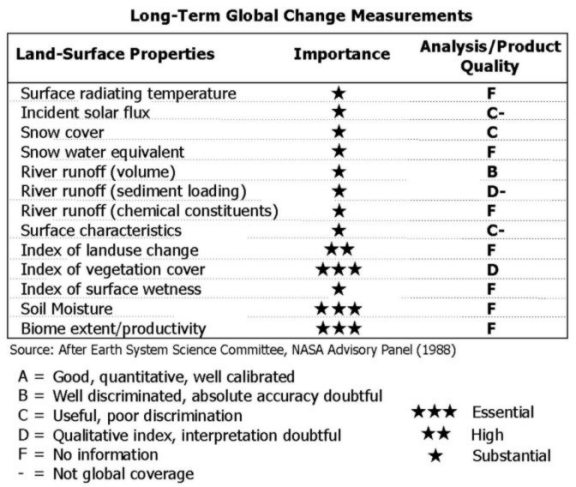
Table III Selected Observational Needs for Land
Related Science Parameters
The fundamental challenges associated with the use of Landsat data for science oriented Earth observations are well laid out in a seminal article by Goward and Williams (1997). The authors state, "The Landsat mission design is directed specifically to capture the detailed spatial heterogeneity and seasonal dynamics of land areas of the Earth". The space and time scales in which components of the Earth system can be observed vary greatly; atmospheric mixing occurs rapidly, changes in ocean currents occur at a slower rate, and the land's surface changes at a much, much slower rate. While atmospheric systems generally display spatial patterns on the order of thousands of kilometers, the changes in the circulation patterns of the oceans vary on the order of hundreds of kilometers, key land surface changes range in scale from meters to kilometers. In the time domain land surface conditions generally vary on a seasonal or inter-annual basis, ocean currents vary over time scales of weeks to months, and the atmosphere changes in terms of hours to minutes.
The particular challenge in monitoring land areas is to capture the patterns of spatially detailed land cover change, within the context of seasonal land cover dynamics (Hall et al., 1991). Imagery is always acquired within a spectral, spatial and temporal context. Images acquired repetitively through time record the dynamics of surface cover change that result from biophysical, geochemical, and socio-economic processes operating within the Earth system. Full seasonal coverage of land cover patterns is important (Townshend, et al., 1991). Decadal records of changes in land surface patterns are also significant (U.S. Department of the Interior, 1995). The "… fundamental technical, monetary, and data handling limits act collectively to constrain satellite remote sensing such that direct trade-offs between spatial and temporal resolutions must be made." (Goward and Hall, 1997). Of the satellite remote sensing systems currently providing data, the Landsat satellites provides an in-between in terms of spatial resolution, aerial coverage and temporal frequency (Goward and Hall, ibid). (See Figure 4)
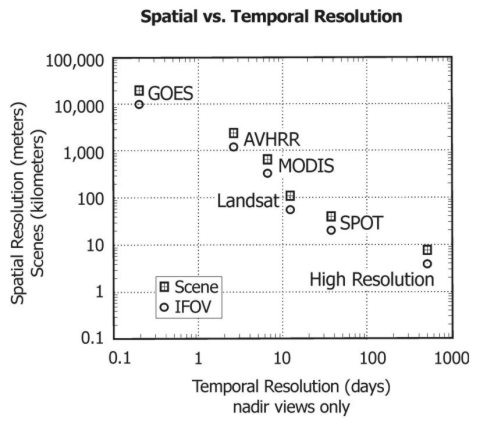
Figure 4. (after Goward and Williams 97) Spatial
resolution in terms of pixels size (IFOV), scene dimensions, and the temporal
resolution for several current remote sensing systems.
If the USGS assumes responsibility for the operations of multiple Landsat, and establishes a coordinated operational regimen, important new areas could be opened for potential research concerning those components of the dynamic Earth system which occur at higher temporal frequency. Landsat data fits a unique niche in global environmental change research. (See Figure 4) The resolution is sufficient for the analysis of fine scale features, such as urban growth and other human induced change, and the scene size facilitates the analysis of large amounts of land area, which is useful for regional scale studies. The availability of Landsat data for global change research is important for science. The potential long term benefits for coordinated operations of Landsat 5 and Landsat 7, in terms of increased repeat time and data continuity, will influence the results of ongoing research projects related to studies of the Earth System (Woodcock, 2000).
Equally important is the USG's data pricing policy.
The USG would implement a COFUR (Cost Of Fulfilling User Requests) pricing policy
for Landsat data. This COFUR data pricing policy for Landsat imagery facilitates
both commercial and science uses of these data. This policy insures that these
data would be made available to users at significantly less than the “market
price” charged under the previous commercial provider. This would ease essential
budgeting constraints in both the science and applications use of Landsat imagery.
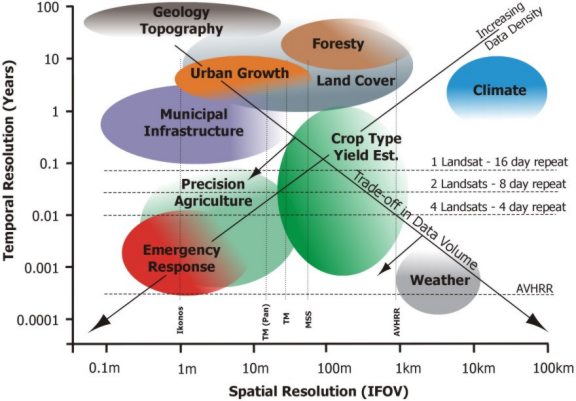
Figure 5. (after Davis et. al. 1991; Goward and
Williams, 1997) Temporal vs. spatial resolution ranges for particular applications
and the tradeoff in terms of data density and volume.
The lower cost and continuous operation of the Landsat systems are important; all it takes is one regional scale disaster, i.e. catastrophic flooding, hurricane damage or a large area wild fire, for people to appreciate the potential of these data. Early in the Landsat program it was realized that Landsat would provide the science community with their first significant opportunity to observe synoptic changes in surface cover, changes that had been difficult to record in the past using aerial platforms (Lauer, et al., 1997). The temporal dimension of remote sensing had, as discussed above, been recognized but seldom usefully employed outside of the Department of Defense. High quality, frequent interval, time series remotely sensed data of land surface features were virtually non-existent to the civilian sector. Landsat’s orbit is such that it maintains a relatively constant solar azimuth across each scene. Users of Landsat data can use the date and time the image was acquired to radiometrically calibrate multi date imagery and compensate for differences in lighting geometry (Lauer, et al., 1997). This ability gave the science and applications communities an ability they had not previously had. The ability to monitor temporal changes in the patterns of land cover types, and correct for spectral anomalies caused by different solar geometry, improved remote sensing applications in areas such as agriculture, forestry, hydrology, and other areas (ASP, 1975; Deutsch and Ruggles, 1974; Morain and Williams, 1975; ASP, 1983).
The early work with Landsat data quickly became more applications oriented, with a funding emphasis shifting from research to the demonstration of science and applications potential. This emphasis was reversed in the late 1970s and 1980s, as the push to commercialize the Landsat system gained momentum. Early applications demonstration projects, regional applications development programs, and students trained in academia in this 1970s period formed a base of practitioners that continue to push forward land-related satellite applications.
Currently, an extremely wide range of applications utilize Landsat data. These applications rely on a variety of supporting technologies including advanced communications, image manipulation and processing, global positioning systems (GPS) and geographic information systems (GIS). Fundamental and applied science uses of Landsat data employ image processing and analysis techniques that typically combine satellite data with other site specific data to measure, map, monitor and model objects and phenomena of interest. Such applications typically have the objective to develop information that will support management decision-making processes at a variety of levels. (See Figure 6) Important here are regional and local scale planning oriented applications which make use of 25 years of Landsat data for mapping urban growth patterns (USGS Homepage, 2000, Jensen and Cowen, 1999).
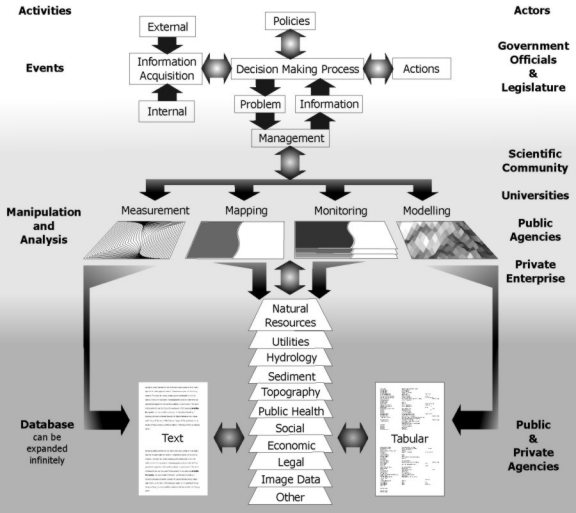
Figure 6. (After UNESCO, 1992). Information exchange
between support management decision-making processes at a variety of levels
As a part of this study, we conducted a review of remote sensing scientific literature published from 1983 to the present. The results of this effort were combined with similar previous research directed at the assessment of European and Asian remote sensing applications programs and an assessment of the status of state and local applications of satellite remotely sensed data (Hadley, et al., 2000; Warnecke, 1997). Results of these studies indicate that currently the most significant use of Landsat data is for conducting land use and land cover inventories, important examples of which are crop monitoring and urban growth studies. Analysis of water resources, forestry, agriculture and emergency management are the other prominent applications. Other applications areas for Landsat data from our review include wetlands assessment, coastal zone management and economic development. Another important example of the use of Landsat imagery is for emergency response efforts. By being able to provide baseline event specific information for the assessment of natural disasters in the U.S., and in other parts of the world, the benefit of having two satellites would be advantageous to decision makers.
The community of stakeholders in the Landsat program is large and diverse. This community includes domestic and international users, including government, industry, academia, and non-governmental organizations. Many users are involved in fundamental research, others are applications oriented. Listing all Landsat stakeholders goes well beyond the scope of this document. The following discussion is meant to provide some general examples of the diversity of this community.
Within the Federal establishment there are a wide variety of users of Landsat data. Agencies that have organizations within them that are major users include:
· The Department of Agriculture
· The Department of Commerce
· The Department of Defense
· The Department of Interior
· The Environmental Protection Agency
· The Department of State
· The Agency for International Development
The National Oceanic and Atmospheric Administration and the National Aeronautics and Space Administration also have centers that use Landsat data. Federal Agencies also directly sponsor research that makes use of Landsat imagery. NASA sponsorship of the Landsat 7 Science Team is an example. This group is comprised of fourteen members from government and academia (and one member is employed by the support contractor for the USGS EROS Data Center). This team is funded to conduct investigations that measure the performance of the Landsat 7 Program and determine if it is demonstrating the potential to support various science investigations in an optimal fashion.
Another example of Federal interagency use of Landsat data is the Multi-Resolution Land Characteristics Consortium (MRLC). MRLC is a group of organizations from a number of Federal Agencies that have banded together to maximize their ability to purchase and process land related remotely sensed data. The consortium was formed in the mid-1990's to acquire, process, and share a national Landsat Thematic Mapper data set that would ultimately be used to generate land characteristics data suited to their specific program needs. The original MRLC participants and their applications were:
· U.S. Geological Survey, Biological Resources Division: The Gap Analysis Project (GAP) used Landsat data to map natural vegetation across the U.S. The vegetation classifications were then used for assessing regional biodiversity and conservation issues.
· U.S. Geological Survey, Water Resources Division: The National Water Quality Assessment (NAWQA) used the data to derive land cover for use in identifying pollution sources within watersheds.
· U.S. Geological Survey, National Mapping Division: The Land Cover Characterization Program (LCCP) produced the first nationally consistent land cover database since the 1970's LUDA Program. This data set is now one of the core USGS spatial databases.
· U.S. Environmental Protection Agency, Office of Research and Development. The Ecological Monitoring and Assessment Program (EMAP) required land cover for a national environmental risk assessment. They used the national land cover database developed through the USGS LCCP.
· National Oceanic and Atmospheric Administration, National Ocean Service: The Coastal Change Analysis Program (C-CAP) conducted land cover change assessments for the nation's coastal zone (including the Great Lakes).
· U.S. Forest Service, Engineering Program. The Remote Sensing Applications Center (RSAC) used the Landsat TM data to derive the forest characteristics data needed to prepare National Forest 10-year plans.
The MRLC 2000 initiative includes two new USFS partners:
· USFS, Forest Inventory and Analsis (FIA): The FIA program plans to use Landsat data in their forest area and volume estimation sampling framework (stratification of forest versus non-forest land).
· USFS, Forest Service, Fire Sciences Laboratory: The Fire Lab is going to use Landsat to develop a national fire fuels database (Loveland, 2000).
This group was originally established during the period of Landsat commercial operations. It has expanded as organizations have seen the inherent advantage of sharing resources for the opportunity to expand their access to satellite remotely sensed data. The MRLC activity continues as NASA and USGS begin collecting baseline data. The latest MRLC data products will be based on Landsat 7 data, and if Landsat 5 is allowed to operate concurrently it can be used to supplement the data collection effort substantially.
At the State government level, approximately one-third of the 50 United States have made extensive use of satellite remotely sensed data. A third of the States have employed Satellite remotely sensed data on a limited or experimental basis. The final third of the 50 states have limited knowledge of satellite remotely sensed data and its use (Warnecke, 1997).
According to Thompson (2000 a) 41% of Landsat scenes are distributed to U.S. Government entities, while 16% are distributed to industry. Academia is the third major category, receiving 12% of scenes distributed. The remaining 31% of Landsat scenes go to various segments of the international community.
As the second largest domestic consumer of Landsat image data, industry has an important stake in the program and its applications. There are a number of value-added companies in the market place that employ Landsat data in applied research and operational programs, an example of which is Pacific Meridian whom Landsat for various applications such as fire fuels mapping and urban/agricultural mapping. These operations are performing specific project work for private industrial concerns and National Government Organizations (NGOs), as well as supporting Federal and State government Agencies. In some cases, Landsat scenes that are distributed to industry are being used for projects in which a governmental entity is the final customer. This indicates that the U.S. Government’s stake in Landsat operations may be even larger than the figures suggest.
Academic institutions are important stakeholders in Landsat. Universities and colleges across the nation employ Landsat data in research and teaching. University scientists (along with governmental researchers) are the principal research users of Landsat data. This academic research community serves as the primary training ground for scientists and technicians who will later utilize Landsat data in research and applications in government and industry.
There are other stakeholders whose interest in the Landsat program is more subtle. These stakeholders include both non-governmental and professional organizations. NGOs such as the Nature Conservancy or Ducks Unlimited use Landsat data in various studies and land management and conservation projects. Other professional organizations are primarily focused on ensuring that the communities they serve have access to these data and that the program remains viable. Examples of such organizations include:
· The World Resources Institute
· The National States Geographic Information
Coordinators
· The Western Governors Associate
· The States Aerospace Association
· The National Council of State Legislators
· The American Society of Photogrammetry
and Remote Sensing
V Challenges and Issues
A key overall challenge for USG's successful operation of multiple Landsats is to maximize the benefits returned to the U.S. taxpayer. The situation where the commercial Landsat data provider markets and prices the data according to commercial rates and operates under a restrictive data policy has proven not to maximize the return on the U.S. taxpayers’ investment. As commercialization of the Landsat series of satellites was implemented, costs increased. Sales of digital data increased (slowly), as well, but sales of film products declined dramatically (Draeger, et al., 1997). Additionally, the restrictive data policy implemented by the commercial Landsat data provider had the effect of dampening sales and research. These conditions made it impossible for some organizations to utilize Landsat data in operational applications and have had a negative impact on the development of the user base which could have potentially established a precedent early on in the Landsat Program for the use of satellite remote sensing data in business, government and science applications.
Commercialization of Landsat had a negative impact on academia. This has, in turn, had an impact on the potential spread of applications based on satellite remotely sensed data within industry and the public sector. In 1976 academic customers purchased some 25,000 photographic images and 270 digital tapes from the USGS EROS Data Center (EDC). Total 1976 sales amounted to approximately $177,000. In 1988 academic customers purchased only about 400 photographic Landsat scenes and some 380 digital tapes at a total cost of some $330,000 (Draeger et al., ibid). Jones (1992), and Estes and Jones (1992) document the dampening of the rising numbers of academic courses being offered in remote sensing and the total numbers of students being taught in these classes. (See Figure 9) Academia is the primary training ground for potential employees of agencies and commercial enterprises which can profit from the use of Landsat data. In addition, students later become entrepreneurs who start businesses (or expand the range of services offered by existing businesses) based upon their academic training. Expanded business opportunities and an increased number of employees generate increased the tax revenue for the United States Treasury, thus increasing the overall return on tax payer investments made in the Landsat program. By providing for coordinated operations of Landsat 5 and Landsat 7, the USG will take advantage of the opportunity to make timely and affordable imagery available for business, government and research applications which will ultimately benefit taxpayers by improving our knowledge of the environment.
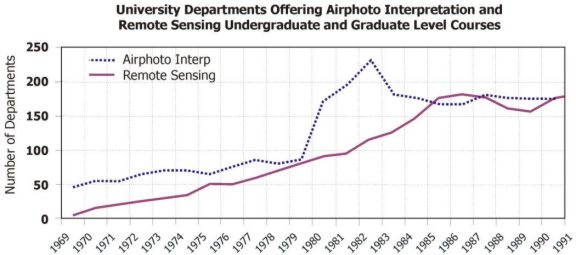
Figure 7. After Jones (1992). The trend in the
number of graduate level courses taught at universities in Remote Sensing and
Airphoto Interpretation from the beginning of the program through the early
90’s.
A significant challenge lies in combining remote sensing and Geographic Information Systems for Earth science studies using the proper nesting of observations at multiple spatial and temporal scales in order to link short-term, fine scale measurements with longer term modeling (Davis et al, 1991). Improving our ability to link multi-scale measurements is a key issue to be faced in monitoring and modeling global change (Rosswall, et al., 1988). A critical issue/question involves how soon the data will be available to make the study of these questions possible. As the price for Landsat data decreases, the number of viable uses of these data will increase. As the temporal resolution of these data increases, the probability of obtaining the data needed to test such hypotheses (and the probability that such experiments will be initiated) likewise will increase.
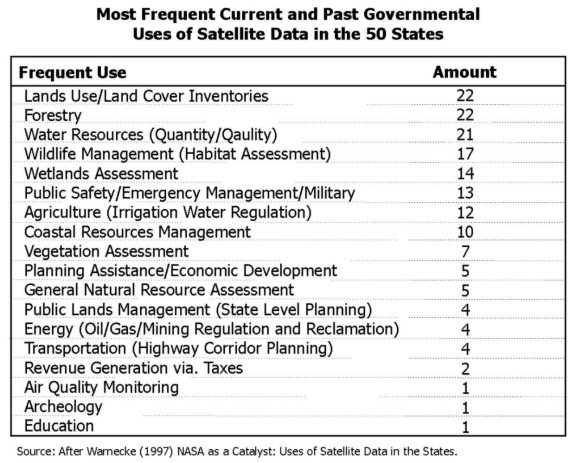
Governmental agencies are by a large margin the most frequent purchasers of Landsat data (Landsat Mission Management Office, ibid). Cataloging all Governmental users of Landsat data would be a monumental task. The previous discussion of stakeholders (in Section IV) lists a number of significant Federal agency users of Landsat data. Warnecke (1997) has documented the use of remote sensing by state level governmental agencies in the United States. The report provides strong support for the notion that some state governments are already applying satellite remotely sensed data to an increasing array of applications. (See Table IV)
Table IV. Instances of the use of satellite remote
sensing data, primarily Landsat TM, for state level applications.
A survey of European and Asian satellite remote sensing applications concluded that the European governmental agencies represent a key market (perhaps the largest segment) for applied remote sensing data products (Hadley, et al., ibid). Many of the respondents interviewed in connection with this study believed that operational applications development will continue to be retarded until better temporal coverage is achieved along with the ability to provide data to users in a timely and affordable fashion following acquisition. Additionally, a literature survey found that Landsat data were used more than any other satellite system. This survey included over 300 applications-oriented peer reviewed journal articles found in 36 different publications for the period 1995 to August 2000.
The rank order of satellite data sources used in European applications articles was:
1. Landsat Thematic Mapper
2. Advanced Very High Resolution Radiometer
3. Synthetic Aperture Radar
4. Systeme Probatoire de la Observation de la
Terre
The rank order of satellite data sources used in Asian applications articles was:
1. Indian Remote Sensing
2. Landsat Thematic Mapper
3. Synthetic Aperture Radar
4. Advanced Very High Resolution Radiometer
Data availability and data costs are cited as the key issues facing the international Landsat science and applications user communities. As the potential for cloud free acquisitions will increase with coordinated operations, science and applications uses of Landsat data will also increase due to the increased availability of lower cost data. Global resource and environmental change science, which inherently have high volume requirements for data, would be facilitated under coordinated operation. The Landsat Program, and the USG, have benefited from the international cooperation that has grown as a result of the USG’s open data policy. Early on in the Space Age the USG, through funding initiatives and the Landsat Program, facilitated the development of an applications user base and a remote sensing science community. By providing for the creation of the knowledge base, expertise and data necessary to take advantage of the technology, the USG has both created and encouraged the development of an international remote sensing science and applications community. Currently several international organizations, along with the USG, are involved in projects which utilize Landsat data for continental to global scale projects. Global change researchers around the world are now tapping the 25+ year long record of global change that the Landsat satellites continue to collect. These large area and long term research projects could greatly benefit from coordinated operations.
In building today’s international Landsat user base, the USG has also helped to insure the long-term profitability of these satellites. An opportunity to maintain both Landsat 5 and Landsat 7 in an operational mode could provide the necessary assurance to the international user community that Landsat data will be available over the long term. This may be what is needed to encourage other nations that acquire civil land satellite remote sensing data to begin to appreciate the advantages of cooperation.
The challenge is to ensure that the above assumptions, that increased data availability will increase science and applications use of Landsat data, are correct. Documenting whether or not reality follows this scenario will take time. The initial period is beginning at the current time. Journal articles which document research based on less expensive Landsat 7 data should begin to appear. It will still be some time before potential applications of these data are demonstrated; applied researchers must go through funding cycles to gain support for projects using Landsat 7 data. Challenges remain for the Landsat stakeholder community. Two key issues of concern are, 1) long-term data continuity/availability, and 2) applications market trends.
VI Discussion of Rationale & Supporting Arguments
There are 11,680 Landsat 183x170 km land scenes that make for complete global coverage (Stoney, ibid). The main reason that scientific applications of remote sensing data can benefit from two Landsat satellites, besides having a backup in case Landsat 7 fails, is the possibility for increased repeat coverage. Having Landsat 5 operating in conjunction with Landsat 7 would provide the opportunity for filling image acquisitions both to augment the global archive and for specific requests that are constrained to a narrow time frame when Landsat 7 may not be available. Landsat 7 imagery may not be available for some regions due to the scene acquisition priority set by the Long Term Acquisition Plan or due to duty cycle limitations that constrain the amount time and duration of image acquisition to about four hours of operating time per 24 hours (Feuquay, 2000). There are two types of temporal coverage to be considered. The first is the global repeat cycle, or the frequency with which all land path/rows will be visited. The second type of temporal coverage is the site revisit frequency - the amount of time between two successive visits to the same area.
The material that follows focuses on the global repeat time and can be generally applied to discussions of both types of temporal coverage. With regard to the site revisit frequency, the ability to acquire imagery of the same area on an almost weekly basis will open new areas of research and increase the feasibility of some important operational applications such as crop monitoring.
For science, the real benefit of coordinated operations would be the increased probability of acquiring cloud free imagery in areas of the world that are frequently covered by clouds. Mapping regional scale land cover on an annual basis is possible with the current system but imagery that is at least 85% cloud free for certain areas at critical times of year are sometimes difficult to acquire. Globally about half of the imaging opportunities should result in substantially cloud free imagery, but localized cloud cover is at best a semi-predictable phenomena. Clouds and seasonal weather patterns occur in all latitude bands and there is considerable variation in their duration, type and timing.
Whether a satellite will be able to acquire cloud free imagery, when treated as an independent non-spatial event, can be considered as a simple conditional probability problem. Ignoring the spatial components in such an analysis may be problematic. These issues will be briefly discussed in the following material. The analysis presented here supports the general conclusion that an opportunity to increase the repeat time is valuable for science.
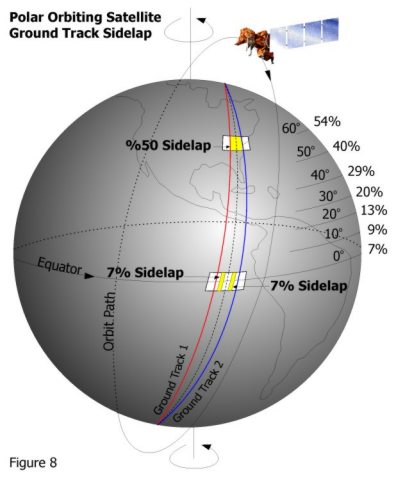
The probability of acquiring cloud free imagery can be treated as a function of latitude and the repeat time of the satellite. Having a near polar orbit means that all of the orbit paths will converge and cross near the poles. Figure 7 shows two adjacent ground tracks and the respective amount of side lap between adjacent paths at the equator and at higher latitude. Utilizing a polar orbit for a land observing satellites produces a relatively small amount of image sidelap between adjacent swaths of imagery near the equator. This overlap between adjacent swaths increases with latitude as the orbits converge towards the north and south poles. With the 183 km wide swath of imagery that the Landsat Thematic Mapper instrument produces, roughly 46 km is covered twice by two adjacent orbit paths when imaging between 300 and 400 north latitude. At 600 north, the sidelap is greater than 50%. At the equator there is less than 10% sidelap and between 20 and 30 degrees latitude there is less than 20% sidelap. The sidelap at high latitudes effectively doubles the chances of cloud free acquisition for a study site that is less than half the width of the swath, but does not significantly improve the chances of cloud free acquisitions over the tropical latitudes.
Landsat 4, 5 and 7 each have a 16 day repeat cycle, with coordinated operations two satellites could have potentially an eight day repeat cycle and with four satellites the repeat cycle could be as frequent as four days. In the future with numerous “Landsat like” satellites coming online this high frequency revisit time may become an operation reality (Stoney, ibid). With one Landsat it is possible to acquire imagery of the same path/row every 16 days, this means that over a period of one year there are 22 chances to acquire imagery of the same area. With two satellites, both with a 16 day repeat time, there would be 45 chances to acquire imagery of the same location, and with four satellites it could be possible to acquire imagery of the same place as many as 91 times per year. For a majority of the Earth’s surface, however, only about half of these chances will result in imagery that is cloud free.
Cloud cover is strongly latitude and season dependent. Seasonal changes in regional weather patterns and ocean currents cause significant variability in winter/spring cloud cover at higher latitudes. As can be seen in the plot of cloud free nadir viewing probability based on work by Harding et. al. 1994 (Figure 8), the chances of acquiring cloud free imagery vary with distance north and south of the equator. The bimodal shape of the probability curve results from the horse latitudes where little precipitation occurs due the dehydrated descending branch of the Hadley Circulation Cell. The peaks of high cloud free nadir viewing probability occur in the desert latitudes around 300 north and 300 south latitude where there are few clouds, and consequently little precipitation, throughout most of the year. The latitude band that marks the Southern Ocean is also clearly visible in the shape of the probability curve; there is no land in the 600 south latitude band and almost continuous cloud cover.
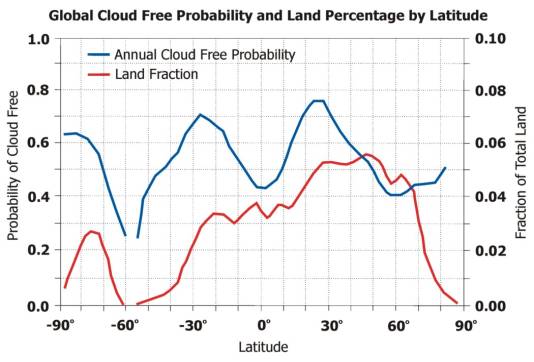
Figure 9. After Harding et. al. (1994). Probability
of a cloud free nadir view and percent landmass by latitude.
This generalized analysis of the probability of cloud free acquisitions does not take into account seasonal and local variations in cloud cover nor does it take into consideration the sidelap between adjacent orbit tracks at higher latitudes. For these reasons is it our belief that discussion presented here regarding the number of cloud free scenes per year may not be completely accurate for some geographic regions, most notably in the tropics and in the higher latitudes.
Figure 8 plots the proportion of land in each latitude band and the corresponding probability of cloud free imaging. The Earth’s landmass is not equally distributed between hemispheres. The Earth consists of approximately 147 million square kilometers of land area, 70% of that is in the Northern Hemisphere. A majority of this is above 300 north latitude (the North American and Asian continents). Thus, cloud cover is a more important determinant for cloud free image acquisition as well as for the overall consistency of the global archive of Landsat images in the northern hemisphere. Near the equator the high energy atmospheric convection of the ascending branch of the Hadley Cell creates almost continuous cloud cover and consistently high precipitation in the tropical latitudes around the globe. There are also seasonal cycles of slash and burn agriculture in the tropics. The smoke from this biomass burning that takes place during the dry season when cloud free image acquisitions are possible can mask the ground with a layer of haze that renders imagery acquired of these areas unusable. In the experience of one scientist who reviewed this paper, there are at best 2-3 cloud free takes per year for his study area in Amazonia (Roberts, 2000).
The probability of cloud cover in 50x50 grid
cells spanning all latitudes shown in figures 8 and 9 was calculated using this
empirical formula derived by Harding et. al. (1994):
Pcf = 1 – m/4 – 0.75(s2 + m2) (1)
Where:
Pcf is the probability of a cloud free line of
sight in any grid cell, and m and s are the mean and standard deviation calculated
based on the percentage of the sky hemisphere in each grid cell containing clouds.
The data used in the analysis by Harding was taken from a summary atlas compiled for the National Center for Atmospheric Research (Warren et. al., 1986). These records of routine weather conditions span the period from 1971-1981 and include about 116 million observations. Using the these data, and taking into consideration the percentage of the land surface within each 50 latitude band, the resulting global probability, weighted by land area, of a cloud free line of sight is 0.56 (Harding et. al., 1994). If there is a 0.56 chance for a cloud free line of sight below the sensor globally, only about 12 of the possible 22 revisits would yield imagery that is likely to be cloud free. Operating Landsat 5 and 7 simultaneously and reducing the repeat time to eight days could potentially increase the number of revisits per location per year to about 45 times. This would produce as many as 25 passes per year when there is a chance for the acquisition of cloud free imagery. This is a significant gain for scientists and others working in tropical and northern latitudes. This difference in repeat time can be critical during important times of year, such as during the Northern Hemisphere harvest season.
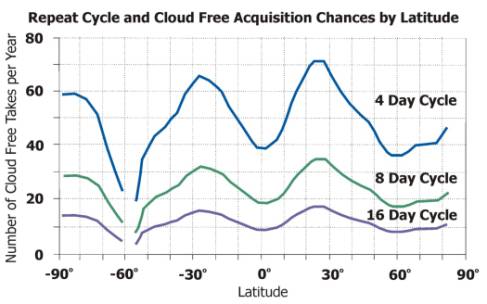
Figure 10. After Harding et. al. (1994) The number
of opportunities for cloud free image acquisition by latitude according to the
repeat cycle
When considering the dependence of cloud cover on latitude, the case for the simultaneous operation of at least two Landsat satellites is even stronger. According to Harding et. al. (1994), there is only a 42% chance of cloud free line of sight around the equator. This means that Landsat 7 operating alone on a 16 day repeat cycle would have a chance to acquire cloud free imagery in the tropical latitudes less than seven times per year according their analysis. (See Figure 13) Furthermore, there is far less overlap between adjacent image swaths near the equator than there is above 400 north and below 400 south latitude where the ground tracks of the satellites converge and cause there to be significant overlap between adjacent swaths. This increases the chance for cloud free imaging of a particular location in the higher latitudes considerably but has not been considered in the statistics presented. The assumptions when assigning probability in this situation are that each satellite acquiring an image of any particular location is an independent event. The following conditions (which may have a significant impact on the probability of cloud free image acquisition over specific geographic regions) are not considered in this analysis:
1. The effect of overlapping image swaths at
higher latitude
2. The effect of the percentage of land at any
particular latitude
3. The seasonality and local scale variation in
cloud cover
In a paper titled The Pecora Legacy - Land Observation Satellites in the Next Century presented by William E. Stoney, the author, shows preliminary results of simulations based on a global grid of cloud probabilities (Stoney, ibid). This paper discusses high resolution Earth observation satellites, equal to or better than Landsat 30 meter resolution. Issues of spectral, spatial and temporal resolution are addressed in the paper. The problem of cloud cover is noted in the paper as one of the strongest arguments for coordinated operation of multiple Earth observing satellites. The grid used in the analysis consists of 11,680 potential land scenes with each grid cell being attributed with the percentage of cloud free area for each day of the year. The cloud free percentages were derived from an Air Force analysis of the cloud conditions for the year 1997 and were provided to Mitretek, the sponsor of the study, by the then GE Aerospace Corp. Figure 10 shows the results of the simulations based on this global grid for one satellite operating on a 16 day repeat cycle and for two satellites both operating on a 16 day repeat cycle. The maps show the cumulative percentages of potential cloud free image acquisitions. (See Figure 11)
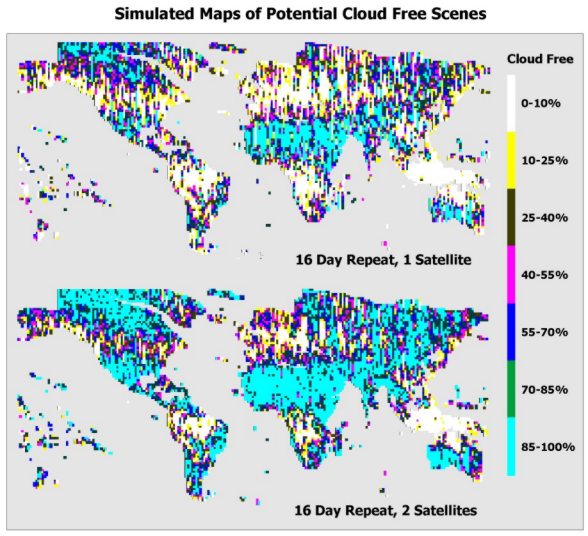
Figure 11. Adapted from Stoney,(1996). Cumulative
percentage of scenes that are at least 85% cloud free for one 16 day orbit cycle
with one and two satellites.
The analysis used to produce the maps in Figure 10 were based on a grid dataset of all possible land scenes attributed with their respective fraction of cloud cover for each day of the year. Using this approach yields the same general conclusion that having multiple satellites will considerably increase the probability of cloud free image acquisitions. In this preliminary work presented by Stoney (1996) individual scenes, as well as scenes composed from a mosaic of neighboring scenes, were considered. To be considered as acceptable a scene, or a mosaiced scene, must be at least 85% cloud free. The legend shows the percentage of acceptable cloud free images that would theoretically result from one complete 16 day orbit cycle. The white, yellow and black areas are concentrated in the tropics and in higher latitudes on both maps but the reduction in overall area of low success with two satellites operating simultaneously is apparent.
The Large-scale Biosphere-Atmosphere Experiment in Amazonia (LBA), a Brazilian-led international research effort directed at understanding hydrological and biogeochemical cycling in the Amazon Basin is currently underway. Atmospheric modeling experiments involving numerous data sources are involved in attempting to quantify the patterns, rates and characteristics of land-use/land-cover change, the hydrologic cycle and the cycle of nutrients and other compounds through tropical ecosystems. According to Asner (2000), and others, the primary source of information about land-use/land-cover is satellite imagery and the current single satellite Landsat system is not sufficient for monthly or even seasonally consistent observations in some areas in tropical South America (Harding, 1994, Stoney, 1996 and Asner, 2000). The research by Asner (2000) into the availability of Landsat for areas in the tropics used archive statistics from 54,170 scenes from 1984 through 1997 acquired within the Amazon basin. All together 229 scenes are required to cover the entire area. Included in his analysis were monthly and annual probabilities for 0 to 100% cloud cover for every scene that were derived from meteorological statistics gathered by the Brazilian Instituto Nacional de Pesquisas Espaciais (INPE). What follows is a summary of the major points and results of this study.
Between 6-13% of the Amazon Basin has a 90-100% chance of being cloud free during the dry season when clouds are least likely in July or August (Asner, 2000). For an image to be considered as cloud free no more than 30% cloud cover was tolerable. When this threshold was reduced to a maximum of 10% for an image to be acceptable, about 40% of the scenes which cover the Amazon had a 90-100% chance of successful acquisition. (See Figure 11) The scenes in the northern part of Amazonia have the highest probability of being cloud covered. Even in the dry season obtaining images with 10% or less cloud cover on an annual cycle is highly improbable for some scenes (Asner, 2000). Projects which seek to address an assessment of forest and non-forest using Landsat imagery alone are severely limited in the northern part of the Amazon Basin and by allowing for coordinated operations the chances of cloud free image acquisition in these low probability areas would significantly increase.
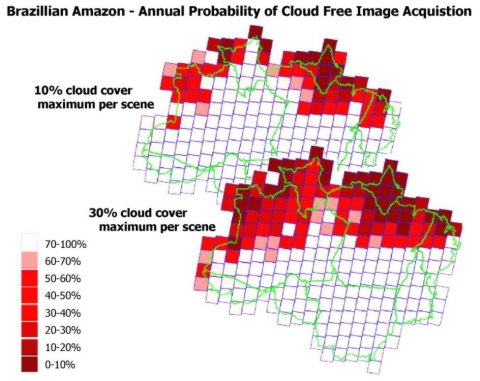
Figure 12. After Asner (2001). Annual probabilities
of acquiring cloud free imagery at the 10% or less and the 30% or less cloud
cover threshold.
The season imagery is acquired is important for assessing pasture age, forest regrowth and green cattle pasture area. The time of year when these land-use/land-cover types are most discernable is early in June during the beginning of the dry season before aerosols and smoke from biomass burning increases the opacity of the atmosphere to the point that the reflected light measured by the satellite is no longer meaningful (typically in the midst of the dry season when new areas of forest are being logged and/or cleared for cattle) (Asner, 2000). Due to the current 16 repeat cycle of the Landsat Program, the window of opportunity for useful imaging in this area of the world is very narrow. (See Figure 12) In terms of assessing annual differences in the amount of logging and clearing, having at least one acceptable image per year for most areas where logging/clearing occurs is critical; logging/clearing during one year may not be detectable using Landsat imagery two years later due to the rapid revegetation which takes place and the relatively small areas which are affected (Asner, 2000). Because so many factors limit acceptable acquisitions in the Amazon the benefit for increasing the probability of successful imaging by implementing coordinated operations is apparent.
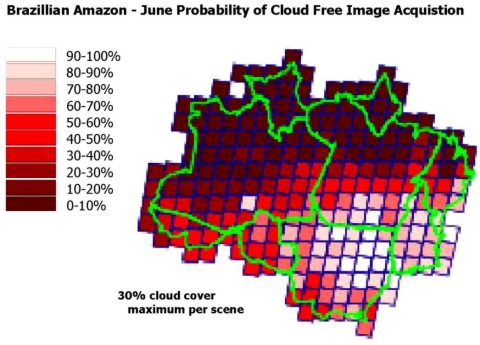
Figure 13. After Asner (2001). Probability of
acquiring a scene that is at most 30% cloud covered during the month of June.
A more thorough analysis of the relationship between repeat time and cloud free image acquisition for the global archive would require that each path/row be treated individually with consideration of season, historical archive statistics, sidelap, variations in land cover and then aggregated at multiple scales. Micro as well as the macro scale factors such as regional weather patterns, land cover variation, local scale topography and proximity to large water bodies contribute to the variation in cloud cover and it is highly likely that if such a database were compiled there would be considerable variation in the probability of cloud free acquisition due to local and regional scale variations. The studies of cloud free imaging probability reviewed in this paper, Harding (1994), Stoney (1996) and Asner (2000), provide some general insight into the difference between having one vs. two satellites in orbit and provide convincing evidence that coordinated operations will result in considerable improvement in acceptable image acquisition.
The need for multi-temporal information of the type that the Landsat series of satellites provides is increasing as programs such as the Millennium Ecosystem Assessment move forward and the use of remotely sensed data to monitor compliance with international treaties, conventions and protocols receives more attention. Increased multi-temporal acquisition of Landsat data would also facilitate generation of continental and global scale mosaics of Landsat data. An example of such a global product is currently under development by Earth Satellite Corporation. Improved seasonal coverage would make it more likely that applications of Landsat data for advanced crop monitoring and mineral exploration could be more fully realized. In addition, higher frequency coverage offers the potential for satisfying a wide range of user data and information needs.
To date, the value of increased temporal frequency for either science or applications oriented investigations is not documented in the literature. There is a growing body of literature that supports the idea that more frequent data acquisition are needed to address science questions and specific applications which are time dependent, including ephemeral events and natural disasters (NASA, 1984, Jackson, 1989, Davis et al., 1991, Jensen and Cowen, 1999, Estes, 2000, Hadley, et al., 2000, Lulla and Dessinov, 2000). During an emergency the higher repeat time offered by coordinated operations will become more valuable. Studies examining the value versus acquisition time for remote sensing data in agricultural applications (Jackson, 1989) and the value to users versus spatial resolution for urban applications (Jensen and Cowen, 1999) are examples of the type of research which should be pursued in order to more fully understand the potential of remotely sensed data in other applications and science areas. (See Figure 13) Again, programmatic issues as well as pricing and data policies have made it difficult to test the true potential of improved observation frequency to address important global change science questions or the development of improved operational applications.
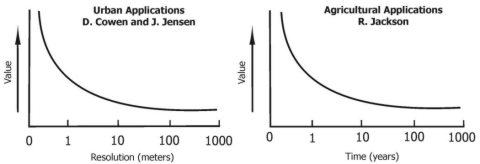
Figure 14. (After Gowen; Jensen; and Jackson)
The trade off in quality and value for spatial and temporal resolution.
VII Conclusions and Recommendations
The basic objective of this document was to consider the possibility that the U.S. Government might be asked to assume operational responsibility for and oversight of operations of Landsat 4 and Landsat 5.
Based upon this study, the following recommendations are made:
1. If the current commercial data provider for
Landsat 4 and 5 should offer to transfer operational responsibility for and
oversight of operations of these satellites to the United States Government,
the Government (specifically the US Geological Survey) should accept.
2. Operational maintenance of Landsat 4, 5, and
7 should be continued as long as is practical.
3. Insure that the next Landsat operations are
coordinated with existing Landsat series satellites.
4. USGS, working with other key Federal Agencies
as appropriate, should initiate a research program directed at documenting the
science and applications potential of Landsat data acquisition operations of
varying temporal frequencies.
It is clear that the management and data distributions policies and practices of the U. S. Government and its attempts at commercialization have prevented the Landsat program from living up to the vision and expectations of its early proponents in terms of the widespread use and application of its data (Draeger, et al., 1997). Unless current policies change, this situation will continue into the indeterminate future. The literature reviewed during this study clearly supports Draeger et. al.’s contention. The commercialization of the Landsat system in the mid-1980s and the accompanying pricing and data policies that were implemented inhibited the use of these data for both fundamental and applied research and had a generally negative impact on scientific progress in the area of remote sensing science.
The Federal establishment has an undeniably important stake in the operations of the Landsat system. The largest volume of Landsat data sold is to governmental agencies and contractors who work for government agencies, both within the United States and Europe. There are numerous well-established Federal, State and Local programs that employ Landsat data in an operational or near operational mode. These programs are directed to address an enormous range of science questions as well as providing input for solving many critical environmental problems. Recognizing this, NASA has recently begun a program specifically directed at increasing the operational use of satellite remotely sensed data at the state government agency level. Regional meetings have recently been held related to this initiative. During these meetings, participants have shown a great deal of interest in the increased availability of lower cost Landsat data.
Although a considerable body of literature exists that documents the benefits of multi-temporal remotely sensed data, there is a lack of documentation of the benefits of high repeat frequency for addressing either science issues or applications oriented questions. Such research could provide important knowledge about future coordinated operations of Landsat are planned under the “Landsat Data Continuity Mission.” The increased potential for returning cloud free imagery that would result from increasing the sensor overpasses frequency is a critically important potential benefit. The benefit of increased repeat frequency could have a notable influence in agricultural related uses of remote sensing data; for crop monitoring a temporal sequence of images are required, and often times weekly vs. biweekly imaging can make a difference during specific time periods during the phenologic cycle of a particular crop. Having multiple satellites increases the probability that usable data will be successfully acquired and will contribute to the widespread operational uses of remote sensing. This argues strongly for testing Landsat 5 and Landsat 7 in such a coordinated operating regime, as well as the Landsat Data Continuity Mission system. The Landsat archive, which spans a quarter century, is one of the most valuable environmental records in existence and maintaining this archive is of paramount importance for scientists involved in global change research. If Landsat 7 were to fail, and there was no backup system, it might be as long as five years before a replacement could be launched. This would leave a huge gap in the archive as well as spell disaster for existing and planned projects, which depend on the availability of Landsat data. If for no other reason than this, Landsat 5 should be operated concurrently with Landsat 7.
Acknowledgements
The author of this report thanks Raytheon Technical Services Company for their support in this effort. Thanks too go out to Mr. R.J. Thompson, Mr. Bruce Quirk and Mr. Jay Feuquay and other personnel of the USGS Eros Data Center for their comments and criticisms over the course of this project. Special thanks are due to Professors Keith Clarke and Dar Roberts of the Geography Department at UC Santa Barbara, Professor Curtis Woodcock of the Department of Geography, Boston University (Landsat Science Team Member), Mr. Edward Sheffner (currently working with the Applications Division Office of Earth Science at NASA Headquarters) and Dr. Darrel Williams (Landsat Project Scientist at NASA Goddard Space Flight Center) for their review and comments on the final draft of this white paper. What is good here was made better by their efforts, any remaining shortcomings are the sole responsibility of the author.
Thanks go to Professor John E. Estes for his knowledge, expertise and involvement in many aspects of the subject matter contained in this work. In life his influence will remain, his role in the field of remote sensing will be remembered, and his comforting pats on the back I will never forget.
Citations
Abrams, M., Comel, J., Lang H., 1984, The Joint NASA/Geosat Test Case Project, Volume I and II. Tulsa, Oklahoma, AAPG Bookstore.
American Society of Photogrammetry (ASP),1975, Manual of Remote Sensing. First Edition, Falls Church, VA, American Society of Photogrammetry, 2144 p.
American Society of Photogrammetry (ASP),1983, Manual of Remote Sensing, Second Edition, Falls Church, VA, American Society of Photogrammetry, 2440 p.
Asner, G., 2001, Cloud Cover in Landsat Observations
of the Brazilian Amazon, International Journal of Remote Sensing, in press.
http://bgc.colorado.edu/asner_publications/Landsat_Amazon_clouds.pdf
Asrar, G., Myneni RB., Li Y., Kanemasu E., 1989, Measuring and Modeling Spectral Characteristics of a Tallgrass Prairie, Remote Sensing of Environment, Vol. 27, No. 2, pp. 143-155
Avery, T. and G. Berlin, 1992, Fundamentals of Remote Sensing and Airphoto Interpretation. Upper Saddle River, NJ, Prentice-Hall, Inc.
Bailey, B., D. Lauer, and D. Carneggie, 2000, International Collaboration: The Cornerstone of Satellite Land Remote Sensing in the 21st Century, Proceedings 51st International Astronautical Congress, IAF Publication, IAF-00-b.1.02, 13 p.
Blair, B, and M. Baumgardner, 1977, Detection of Green and Brown Wave in Hardwood Canopy Covers Using Multi-date, Multi-spectral data from Landsat-1, Agronomy Journal, Vol. 69, pp. 808-811
Carneggie, D. 2000, Personnel Communication fax transmission, “Landsat 7 Program Report FY 2000”. Page 19 International Support, listing the status of ground receiving stations.
Coops, N., 1999, Improvement in Predicting Stand Growth of Pinus radiata (D. Don) across Landscapes Using NOAA AVHRR and Landsat MSS Imagery Combined with a Forest Growth Process Model (3-PGS), Photogrammetric Engineering and Remote Sensing, Vol. 65, No. 10, pp. 1149-1156
Davis, F., D. Quattrochi, M. Ridd, N. Lam, S. Walsh, J. Michaelson, J. Franklin, D. Stow, C. Johanssen, and C. Johnston, 1991, Environmental Analysis Using Integrated GIS and Remotely Sensed Data: Some Research Needs and Priorities, Photogrammetric Engineering and Remote Sensing, Vol. 57, No. 6, pp. 689-697
Draeger, T. Holm, D. Lauer, R. Thompson, 1997, Photogrammetric Engineering and Remote Sensing, Vol. 63, No., pp. 869-875
Deutsch, M., and F. Ruggles, 1974, Optical Processing and Projected Applications of the ERTS-1 Imagery Covering the 1973 Mississippi River Valley Floods, Water Resources Bulletin, Vol. 10, No.5, pp. 1023-1039
Duetsch, M., D. Wiesnet, and A. Rango, 1979, Satellite Hydrology, 5th Annual W.T. Pecora Memorial Symposium on Remote Sensing, Minneapolis, MN, American Water Resources Association 730 p.
Earth Satellite Corporation, 1974, Evaluation of Economic, Environmental, and Social Costs and Benefits of Future Earth Resource Survey Satellite Systems, Washington D.C., Earth Satellite Corporation, 405 p.
Earth System Science Committee, 1988, Earth System Science: A Closer View, Washington, D.C., National Aeronautics and Space Administration, Earth System Science Committee, NASA Advisory Council, 208 p.
ECON Incorporated, 1974, The Economic Value of Remote Sensing of Earth Resources from Space an ERTS Overview of the Value of Continuity of Service, Princeton, NJ, ECON Incorporated, 389 p.
Ellickson, J., 1998, Minutes from Landsat Civil
Agency Requirements Working Group, NASA Headquarters. February 26, 1998.
http://geo.arc.nasa.gov/sge/landsat/lcarwg3.html
Ehlers, M., 2000, Personnel Communication via email, September 8, Santa Barbara, CA.
Estes, J. and L. Senger, 1974, Remote Sensing: Techniques for Environmental Analysis, Santa Barbara, CA, Hamilton Publishing Company 340 p.
Estes, J., 2000, Comparative Perspectives on Technology Transfer: GIS and GPS, Presentation at Knowledge Transfer: Strategies for the Future, Washington D.C., NAS, Space Studies Board Workshop on Moving Remote Sensing from Research to Applications May 2, 2000
FAOSTAT, 2000, Food and Argiculture Organization
Webpage.
http://apps.fao.org/
Feuquay, J. 2000, Personnel Communication from USGS Eros Data Center.
Flynn, L., P. and Mouginins-Mark, 1995, A Comparison of the Thermal Characteristics of Active Lava Flows and Forest Fires, Geophysical Research letter, Vol. 22, pp. 2577-2580
Goward, S.,1989, Satellite Bioclimatology, Journal of Climate, Vol. 7, No. 2, pp. 710-720
Goward, S. and D. Williams, 1997, Landsat and Earth System Science: Development of Terrestrial Monitoring, Photogrammetric Engineering and Remote Sensing, Vol. 63, No. 7, pp. 887-900
Hadley, B., J. Estes, and J. Scepan, 2000, European and Asian Remote Sensing Applications: A Literature Review and Analysis, Annadale, VA., Global Initiatives Inc. IDIQ Task 0014, 172 p.
Hall F., D. Botkin, D. Strebel, K. Woods, and S. Goetz, 1991, Large Scale patterns of Forest Succession as Determined by Remote Sensing, Ecology, Vol. 72, No. 2, pp. 628-640
Harding, David J., Bufton, Jack L., and Frawley, James J., 1994, Satellite Laser Altimetry of Terrestrial Topography: Vertical Accuracy as a Function of Surface Slope, Roughness, and Cloud Cover, IEEE Transactions on Geosciences and Remote Sensing, Vol. 32 No. 2.
Holz, R.,1973, The Surveillant Science: Remote Sensing of the Environment, Boston, MA, Houghton Mifflin Company. 390 p.
Irish, Richard, 1998, Automatic Cloud Cover Assessment (ACCA). Viewgraph Presentation for Landsat-7 Science Team Meeting, NASA – Goddard Space Flight Center.
Jackson, R., 1989, Time Issues in Remote Sensing Applications in Irrigated Agriculture, Personnel Communication, with J. E. Estes. Santa Barbara, CA.
Jensen, J., 1996, Introductory Digital Image Processing: A Remote Sensing Perspective, Upper Saddle River, NJ. Prentice-Hall, Inc., 316 p.
Jensen, J., 2000, Remote Sensing of the Environment: An Earth Resources Perspective, Upper Saddle River, NJ. Prentice-Hall, Inc., 544 p.
Jensen, J. and D. Cowen, 1999, Remote Sensing of Urban/Suburban Infrastructure and Socio-Economic Attributes, Photogrammetric Engineering and Remote Sensing, Vol. 65, pp. 611-622
Jones, D., 1992, Landsat Commercialization and its Impact on Remote Sensing Research and Education at Colleges and Universities in the United States, Unpublished Master Thesis, Department of Geography, University of California, Santa Barbara, CA, 62 p.
Estes, J. E. and David R. Jones, 1992, "Education's Role in Environmental Monitoring Market Development", Proceedings, 4th International Forum and Exhibition for Space Technology, Development and Business, 23-26 March, 1992, Montreux, Switzerland, Gordon and Breach Science Publishers, pp. 183-190
Kauth, R. and G. Thomas, 1976, The Tasseled Cap – A Graphic Description of the Spectral-Temporal development of Agricultural Crops as seen by Landsat, 10th Symposium on Machine Processing of Remotely Sensed Data, West Layfette, IN, Purdue University pp.41-51
Kettles, I., A. Rencz, S. Bauke, 2000, Integrating Landsat, Geologic and Airborne Gamma Ray Data as an Aid to Surficial Geologic Mapping and Mineral Exploration in the Manitouwadge Area, Ontario, Photogrammetric Engineering and Remote Sensing, Vol. 66, No. 4, pp. 437-445
Komar, G. et al., 1996, The Landsat Program:
Toward Landsat 7 and Beyond, Paper on Landsat presented at the Pecora 13 Symposium,
Sioux Falls, South Dakota, August 20-22, 1996. Landsat Program Homepage.
http://geo.arc.nasa.gov/sge/landsat/pecora.html
Kumar, M. and J. Montieth, 1982, Remote Sensing of plant Growth, Plants and the Daylight Spectrum, London, Pitman, pp. 133-144
Krzyczkowski, R., D. Powell, and E Putnam,1971, Review and Appraisal: Cost-Benefit of Earth Resource Survey Satellite Systems. Santa Barbara, CA, Interplan Corporation,150 p.
Landsat 4/5 Pricing, Landsat Program Homepage.
updated 5/1/97.
http://geo.arc.nasa.gov/sge/landsat/apr11.html
Landsat Mission Management Office, 2000, Landsat 7 Overview, USGS, EDC, Viewgraph Presentation, August 16, 2000, 51 p.
Landsat Science Team Homepage. updated April
10, 1998.
http://www.geog.umd.edu/landsat7/public.html
Lauer, D., 1990, An Evaluation of National Policies Governing the United States Civilian Satellite Land Remote Sensing Program. Ann Arbor, MI, University Microfilms International, 396 p.
Lauer, D., S. Morain, and V. Salomonson, 1997. The Landsat Program: It’s Origins, Evolution and Impacts, Photogrammetric Engineering and Remote Sensing, Vol. 63, No. 7, pp. 831-838
Lauer, D., 2000, International Cooperation in the development of Land Observing Satellites, presentation at the 4th SAI Users Conference, May, 2000, Stresa, Italy.
Loveland, T, 2000, Personal Communication, MRLC Applications, Email to J. Estes, Date: Sat, 28 Oct 2000.
Lulla, K., and L. Dessinov, 2000, Dynamic Earth Environments: Remote Sensing Operations from Shuttle Mir Missions, New York, John Wiley & Sons, Inc., 268 p.
Lunetta, R., and M. Balogh, 1999. Application of Multi-Temporal Landsat 5 TM Imagery for Wetland Identification, Photogrammetric Engineering and Remote Sensing, Vol. 65, No. 11, pp. 1303-1310
Mack, P., 1981, Space Science for Applications: The History of Landsat. Space Science Comes of Age: Perspectives in the History of Space Science, H. A. Chamberlin. Washington, D.C., Smithsonian Institute Press, pp. 135-148.
Mark, H., 1988, A Forward Looking Space Policy for the USA, Space Policy, Vol. 4, No. 3, pp. 19-23
Mika, A, 1997, Three Decades of Landsat Instruments, Photogrammetric Engineering and Remote Sensing, Vol. 63, No. 7, pp. 839 – 852
Morain, S., D. Williams, 1975. Wheat Production Estimates Using Satellite Images, Agronomy Journal, Vol. 67, No. 3, pp. 361-364
Moran, M., R. Jackson, L. Raymond, L. Gay, and P. Slater, 1989, Mapping Surface Energy Balance Components by Combining Landsat Thematic Mapper and Ground-based Meteorological Data, Remote Sensing of Environment, Vol. 30, pp. 77-87
Myers, V., 1975, Remote Sensing Applications in Agriculture, Chapter 33, p. 2200-2210, Large Area Crop Inventory Experiment (LACIE), American Society of Photogrammetry (ASP),1975. Manual of Remote Sensing. First Edition, Falls Church, VA, American Society of Photogrammetry, 2144 p.
National Academy of Sciences, 1970, Remote Sensing with Special Reference to Agriculture and Forestry, Washington, D.C., National Academy of Sciences, 424 p.
National Aeronautics and Space Administration, 1984, Earth Observing System: Science and Mission Requirements, Working Group Report, Vol. I, Technical Memorandum 86129, Greenbelt, MD., Goddard Space Flight Center, 58 p.
National Satellite Land Remote Sensing Data Archive (NSLRSDA) Advisory Committee Meeting Minutes EROS Data Center, Sioux Falls, South Dakota April 21-23, 1999 http://edc.usgs.gov/programs/nslrsda/advisory/Apr99Min.html
National Reconnaissance Office Homepage. Corona
History and Information.
http://www.nro.odci.gov/index5.html
Nelson, R., N. Horning, and T. Stone, 1987, Determining the Rate of Forest Conversion in Mato Grosso, Brazil Using Landsat MSS and AVHRR Data, International Journal of Remote Sensing, Vol. 8, pp. 1767-1784
Pecora, W., 1972. Remote Sensing of Earth Resources: Users, Prospects, and Plans, NASA's Long-Range Earth Resources Survey Program, Thirteenth Meeting, Panel on Science and Technology, Committee on Science and Astronautics, U.S. House of Representatives, January, 25, Washington D.C. U.s. Government Printing Office, 8 p.
Program Chronology, updated November 4, 1998.
Landsat Program Homepage.
http://geo.arc.nasa.gov/sge/landsat/lpchron.html
Richardson, A. and C. Wiegand, 1977, Distinguishing Vegetation from Soil Background Information, Photogrammetric Engineering and Remote Sensing, Vol. 43, pp. 1541-1552
Roberts, D., 2000, Personnel Communication, University of California Santa Barbara Nov. 2000.
Rouse, J., Haas, R., Schell, J., and Deering, D., 1973, Monitoring Vegetation Systems in the Great Plains with ERTS; 3rd ERTS Symp., NASA SP-251, I:309-317
Rosswall, T., R. Woodmansee, and P. Risser (eds.), 1988, Scales and Global Change: Spatial and Temporal Variability in Biospheric and Geospheric Processes, Scientific Committee on Problems of the Environment (SCOPE), 35, New York, John Wiley and Sons, 355 p.
Scott, M., 2000, Personnel Communication via. fax, Fish and Wildlife Resources, Species Listing Under ESA, World Conservation Monitoring Program, “Time series of annual extinctions on islands and continents”.
Sheffner, E.J., 2000. Personnel Communication via. Email from NASA Headquarters, Nov. 2000.
Sheffner, E.J., 1996, The Landsat Program and
Landsat Science, Presentation on Landsat Program Policy at Landsat Science Working
Group, Greenbelt, Maryland, October 15-17, 1996. Landsat Program Homepage.
http://geo.arc.nasa.gov/sge/landsat/lswg.html
Skole, D. and C. Tucker, 1993, Tropical Deforestation and Habitat Fragmentation in the Amazon: Satellite Data From 1978-1988, Science, Vol. 260, pp. 1905-1910
Space Applications Board, 1975, Practical Applications of Space Systems, Supporting Paper 11, Costs and Benefits, Washington D.C., Nat. Res. Council, National Academy of Science: 40 p.
Stoney, W.E. 1996 "The Pecora Legacy - Land Observation
Satellites in the Next Century". Paper on Landsat presented at the Pecora 13
Symposium, Sioux Falls, South Dakota, August 20-22, 1996, Landsat Program Homepage.
http://geo.arc.nasa.gov/sge/landsat/wes.html
Stoney, W.E. 1997, "Land Sensing Satellites in the Year 2000". Presentation at IGARSS Symposium, Singapore, August 7, 1997, Landsat Program Homepage. http://geo.arc.nasa.gov/sge/landsat/wesigrs.html
Thomas, Gerald B., 1998, Analyzing environmental policy change : U.S. Landsat policy, 1964-1998. Unpublished Doctoral Dissertation, Colorado State University.
Thomas, Gerald B., 1998, U.S. Civilian Land Remote-Sensing
Policy: Incompetence or Compartmentalized Rationality? Unpublished Independent
Study. Colorado State University.
http://www.colostate.edu/Depts/PoliSci/landsat1.html
Thompson, R., 2000 a, Landsat 7 a Global Mission Update, A Viewgraph Presentation to the Maryland Space Business Round Table, MSBR 098_26_00. ppt, EROS Data Center, Sioux Falls, SD
Thompson, R., 2000 b, Personnel Communication, Eros Data Center October, 2000.
Townshend, J., C. Justice, W. Li, C. Gurney, and J. McManus, 1991, Global Land Cover Classification by Remote Sensing: Present capabilities and Future possibilities, Remote Sensing of Environment, Vol. 35, pp. 243-255
Townshend, J., V. Bell, A. Desch, C. Havelick, C. Justice, W. Lawrence, D. Skole, W. Chomentowski, B. Moore, W. Salas, and C. Tucker, 1995, The NASA Pathfinder Humid Tropical Deforestation Project, Land Satellite Information in the Next Decade, Falls Church VA, American Society of Photogrammetry and Remote Sensing, pp. IV 76-87
Tucker, CJ, 1978, Comparison of Satellite Sensor Bands for Vegetation Monitoring, Photogrammetric Engineering and Remote Sensing, Vol. 44, No. 11, pp. 1369-1380.
UNESCO, 1992, Environment and Development Briefs, No. 3, New Technologies, Remote Sensing and GIS, Pasis UNESCO and SCOPE, 16p.
U.S. Congress, U.S, 1977, Earth Resources and Environmental Information Act of 1977, Subcommittee on Science, Technology, and Space, Committee on Commerce, Science, and Transportation, Washington D.C., U.S. Government Printing Office: 352.
U.S. Department of Commerce,1980, Planning for a Civil Operational Land Remote Sensing Satellite System: A Discussion of Issues and Options. Rockville, MD, NOAA Satellite Task Force: 130.
US Department of the Interior, U.S. geological Survey, 1995, Historic Landsat Data Comparisons, Illustrations of the Earth's Changing Surface, Sioux Fall, SD. USGS, EROS Data Center, 45p.
USGS Homepage, 2000, San Francisco Urban Growth,
Change Detection and Mapping.
http://sfbay.wr.usgs.gov/access/urban.html
http://terraweb.wr.usgs.gov/TRS/projects/SFBay/
VAP, 1999, Landsat 7 Value Added Processors (VAP)
Workshop Summary, USGS National Center Reston, VA. March 4, 1999.
http://geo.arc.nasa.gov/sge/landsat/vameet/L7vaw.html
Warren, S., C. Hahn, J. London, R. Chervin, R. Jenne, 1986, Global Distribution of Total Cloud Cover and Cloud Type Amounts Over Land, National Center for Atmospheric Research, Scientific and Technical Notes, NCAR/TN-273-STR, Boulder, CO.
Warnecke, L., 1997, NASA as a Catalyst: Use of Satellite Data in the States, Washington, D.C., NASA, Office of Mission to Planet Earth, 204 p.
Weinstein, R., 1980, NASA Perspective, Western Regional Remote Sensing Conference proceedings – 1979, Washington D.C., NASA Conference Publication 2148, pp. 1-4 –1-7.
White House, 1979, Civil Operational Remote Sensing, Presidential Directive/National Security Council-54, Washington D.C.: 3 p.
White House, 2000, Amendment to Presidential Decision Directive/NSTC-3, Washington, Executive Office of the President, Office of Science and Technology Policy,2 p.
Wolter, P., D. Mladenoff, G. Host, and T. Crow, 1995, Improved Forest Classification in the Northern Lake States Using Multi-Temporal Landsat Imagery, Photogrammetric Engineering and Remote Sensing, Vol. 61, No. 9, pp. 1129-1143
Woodcock C. 2000. Personnel Communication from U. Boston via email.
Zissis, G., K. Heiss, and R. Summers, 1972, Design
Study to Evaluate the Benefits and Costs of Data from the First Earth Resources
Technology Satellite (ERTS-A). Ann Arbor, MI, Willow Run Laboratories: 243 p.